
- Natural Gas gives back earlier gains and turns red.
- Traders are looking at the weak spots in the European Gas supply.
- The US Dollar index trades around 105.00 and could face another leg lower.
Natural Gas price (XNG/USD) trades in the red after positive news emerged for the European gas flow. Norwegian Gas is flowing again at full throttle into Europe, the recent unforeseen outage from the Nyhamna Gas Plant in Norway shows how fragile and dependent Europe is on other countries to fill the gap from Russian Gas. This might create a synthetic floor in the Gas price action as any disruption will have ripple effects for Europe.
Meanwhile, the US Dollar Index (DXY), which tracks the Greenback’s value against six major currencies, is easing a touch this week. Although the US markets are closed in observance of Juneteenth, traders will be trying to wrap their heads around the downbeat US Retail Sales report for May, released on Tuesday. The softer-than-expected Retail Sales may signal that consumers can no longer cope or bear with these elevated interest rates.
Natural Gas is trading at $2.95 per MMBtu at the time of writing.
Natural Gas news and market movers: Europe back to refueling
- On Wednesday, Norwegian Gas regulator Gassco reported that the unforeseen maintenance at the Nyhamna Gas Plant was resolved, and the site is back in full production, Bloomberg reports.
- Recent Gas supply data shows that, although European gas reserves are building, they are doing so at a slower pace, Reuters reports.
- Uniper and the German government still have not taken a stance on how or when they will try to reclaim the billions in undelivered Gas from Gazprom PJSC.
- Bloomberg reports that investment funds have built up positions in the assumption European gas prices will rise, highlighting increasing concerns over fuel supplies seeing the recent Norwegian outages.
Natural Gas Technical Analysis: Achilles heel
Natural Gas prices have little reason to go either way in these conditions. Gas flow into Europe remains fragile and exposed, with any interruption enough to send Gas prices a few percentages higher. Meanwhile, easing tensions in the Middle East and Europe’s ability to secure enough Gas before the next heating season looks to be a bearish element that limits continuous upside price moves.
The pivotal level near $3.08 (March 6, 2023, high) remains key after its false break last week. In addition, the red descending trendline at $3.10 will also weigh on this area as a cap. Further up, the fresh year-to-date high at $3.16 is the level to beat.
On the downside, the 200-day Simple Moving Average (SMA) acts as the first support near $2.54. Should that support area fail to hold, the next target could be the pivotal level near $2.14, with interim support by the 55-day SMA near $2.46. Further down, the biggest support comes at $2.19 with the 100-day SMA.
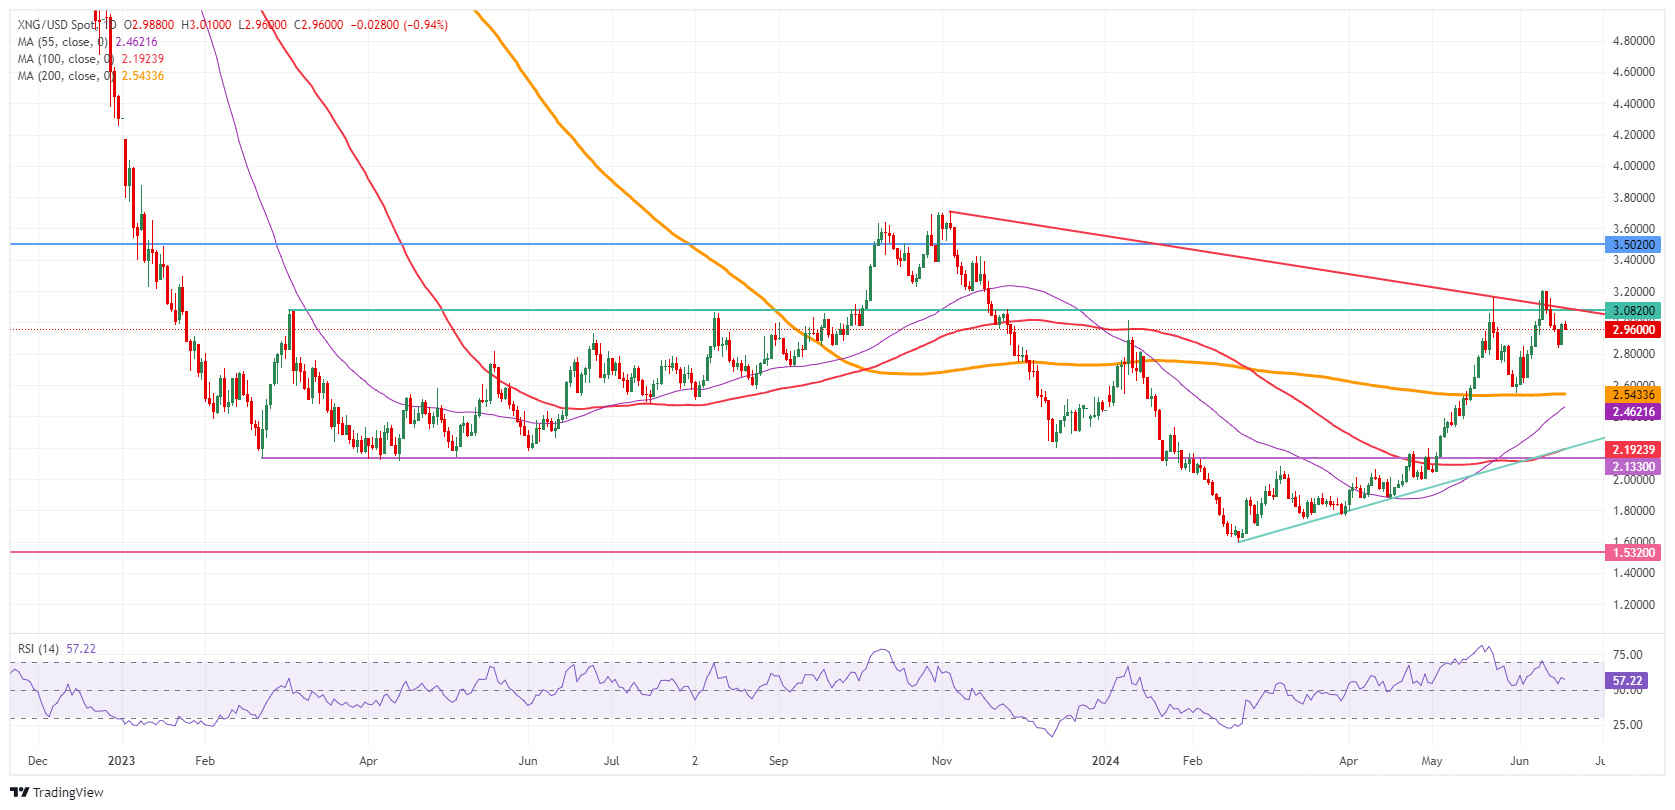
Natural Gas: Daily Chart


