
- The Australian Dollar declines as the US Dollar remains stronger on the hawkish Fed.
- 90% of economists anticipate stable RBA rates in Q3, with a potential 25 basis-point reduction by the end of 2024.
- The US Dollar (USD) remains stable due to the hawkish stance of the Fed.
The Australian Dollar (AUD) edges lower as the US Dollar remains stronger due to higher US Treasury yields on Friday. However, the AUD/USD pair attempted to recover its daily losses earlier in the day following a Reuters poll of 43 economists. The poll predicts that the Reserve Bank of Australia (RBA) could maintain its current interest rates in June. A significant 90% of economists anticipate stable interest rates in the next quarter, with a potential 25 basis-point reduction to 4.10% projected by the end of 2024. Furthermore, 63% of economists foresee interest rates declining to 4.10% or below by year-end, while a minority (35%) expect no change.
The US Dollar (USD) has maintained stability following gains from the previous session despite the release of economic data showing a softer US Producer Price Index (PPI) and higher-than-expected Initial Jobless Claims. Federal Open Market Committee (FOMC) policymakers have revised their outlook, now anticipating only one rate cut for the year, down from the three cuts forecasted in March. This adjustment is bolstering the US Dollar's (USD) resilience and exerting pressure on the AUD/USD pair.
Investors are awaiting the release of the preliminary US Michigan Consumer Sentiment index on Friday. This key indicator will offer additional insights into consumer confidence and the broader economic outlook.
Daily Digest Market Movers: Australian Dollar may limit its downside due to hawkish RBA
- US Initial Jobless Claims for the week ending June 7 showed a significant increase, with the number of claims rising by 13,000 to 242,000. This figure surpassed market expectations, which were set at 225,000, marking the highest level of jobless claims since August 2023.
- US Producer Price Index (PPI) came in weaker than expected, increasing 2.2% YoY in May, compared to the 2.3% rise in April (revised from 2.2%). Meanwhile, the core PPI figure rose 2.3% YoY in May, below the consensus and April’s reading of 2.4%.
- Australia’s Employment Change showed on Thursday that the number of employed people increased by 39.7K in May, exceeding the expected 30.0K increase and the previous 38.5K rise. Meanwhile, the Unemployment Rate came in at 4.0%, below April’s 4.1% rate as expected.
- At its June meeting on Wednesday, the Federal Open Market Committee (FOMC) kept its benchmark lending rate unchanged within the range of 5.25%–5.50%, marking the seventh consecutive meeting without a rate change, as widely anticipated. In a press conference post Fed decision, Fed Chair Jerome Powell noted that the restrictive stance on monetary policy is having the effect on inflation that the central bank had expected. Additionally, FOMC policymakers expect just one rate cut this year, down from three in March.
- On Tuesday, National Australia Bank (NAB) Chief Economist Alan Oster commented, “There are warning signs on the outlook for growth but at the same time reasons to be very wary about the inflation outlook, and they expect the RBA to keep rates on hold for some time yet as they navigate through these contrasting risks,” as per the official transcript.
- Last week, RBA Governor Michele Bullock indicated that the central bank is prepared to increase interest rates if the Consumer Price Index (CPI) does not return to the target range of 1%-3%, according to NCA NewsWire.
Technical Analysis: Australian Dollar remains below 0.6650
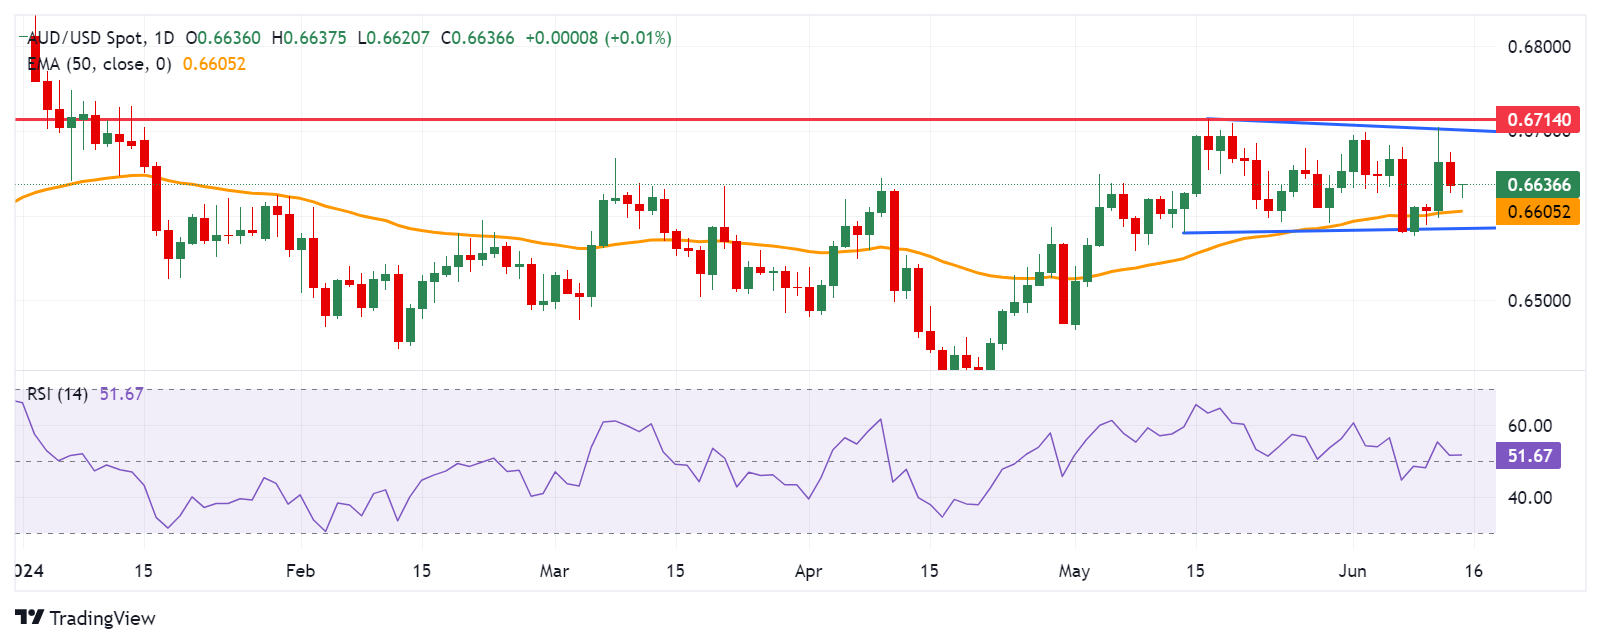
The Australian Dollar trades around 0.6630 on Friday. Analysis of the daily chart reveals a neutral bias for the AUD/USD pair as it consolidates within a rectangle formation. The 14-day Relative Strength Index (RSI) has recently crossed above the 50 level, indicating a potential bullish bias emerging.
In terms of immediate levels, the AUD/USD pair finds support around the 50-day Exponential Moving Average (EMA) at 0.6605, with further support at the lower boundary of the rectangle formation near 0.6585.
Looking upwards, the AUD/USD pair could test resistance near the upper boundary of the rectangle formation around 0.6700, followed by the high from May at 0.6714.
AUD/USD: Daily Chart
Australian Dollar price in the last 7 days
The table below shows the percentage change of the Australian Dollar (AUD) against listed major currencies in the last 7 days. The Australian Dollar was the weakest against the US Dollar.
| USD | EUR | GBP | CAD | AUD | JPY | NZD | CHF | |
| USD | 1.64% | 0.52% | 0.62% | 0.85% | 1.42% | 0.98% | 0.49% | |
| EUR | -1.69% | -1.14% | -1.06% | -0.82% | -0.24% | -0.69% | -1.20% | |
| GBP | -0.53% | 1.13% | 0.10% | 0.33% | 0.91% | 0.45% | -0.06% | |
| CAD | -0.62% | 1.04% | -0.09% | 0.23% | 0.82% | 0.36% | -0.14% | |
| AUD | -0.86% | 0.81% | -0.32% | -0.23% | 0.59% | 0.13% | -0.38% | |
| JPY | -1.45% | 0.24% | -0.92% | -0.84% | -0.58% | -0.47% | -0.98% | |
| NZD | -0.99% | 0.69% | -0.45% | -0.36% | -0.12% | 0.45% | -0.51% | |
| CHF | -0.48% | 1.19% | 0.05% | 0.13% | 0.38% | 0.97% | 0.50% |
The heat map shows percentage changes of major currencies against each other. The base currency is picked from the left column, while the quote currency is picked from the top row. For example, if you pick the Euro from the left column and move along the horizontal line to the Japanese Yen, the percentage change displayed in the box will represent EUR (base)/JPY (quote).


