
- Indian Rupee trades in negative territory on Friday amid the stronger US Dollar.
- The Indian WPI Inflation came in hotter than expected, rising 2.61% YoY in May from 1.26% in April.
- The hawkish Fed projection suggested only one rate cut is likely in 2024, weighing the INR.
- Investors await the preliminary US Michigan Consumer Sentiment report, which is due on Friday.
Indian Rupee (INR) weakens on Friday on the extended gains of US Dollar (USD). The INR remains under some selling pressure despite the hotter-than-expected Indian inflation data. The recent economic data showed that India’s Wholesale Price Index (WPI) Inflation rose 2.61% YoY in May from 1.26% in the previous reading, above the market consensus of 2.50%.
The projections that the US Federal Reserve (Fed) will cut rates only once by 25 basis points (bps) this year instead of the two that the consensus had expected weighs on the INR. Additionally, the higher crude oil prices could further cap the upside for the local currency as India is the third largest consumer of oil behind the US and China.
Nonetheless, the Reserve Bank of India’s (RBI) intervention will be crucial in stabilizing the INR and preventing it from significant depreciation. Later on Friday, investors will keep an eye on the US preliminary Michigan Consumer Sentiment report and the speech by the Fed Bank of Chicago President Austan Goolsbee.
Daily Digest Market Movers: Indian Rupee edges lower amid the Fed’s hawkish stance
- India’s WPI Food climbed 9.82% YoY in May, compared to 7.74% in April. Meanwhile, the WPI Fuel increased by 1.35% in the same period, compared to 1.35% in April.
- State-run banks were spotted offering USD through the day's session, likely on behalf of the RBI, but they "were holding the level" instead of pushing the INR towards appreciation, a foreign exchange trader at a private bank said.
- The benchmark S&P BSE Sensex ended the session up 204.33 points, or 0.27%, at 76,810.90, while the NSE Nifty index closed at 23,398.90, up 75.95 points, or 0.33% from its previous close.
- The US Producer Price Index (PPI) rose 2.2% YoY in May, compared to the 2.3% increase in April (revised from 2.2%), below the market expectation of 2.5%. The core PPI figure climbed 2.3% YoY in May, below the estimation and previous reading of 2.4%.
- On a monthly basis, the US PPI declined 0.2% in May, while the core PPI remained unchanged at 0%.
- The US weekly Initial Jobless Claims for the week ending June 6 increased by 242K from the previous week's reading of 229K. This figure came in above the market consensus of 225K.
- Fed Chair Jerome Powell said that only "modest" progress had been achieved towards meeting the target and that the US central bank would need "good inflation readings" before cutting interest rates, per the BBC.
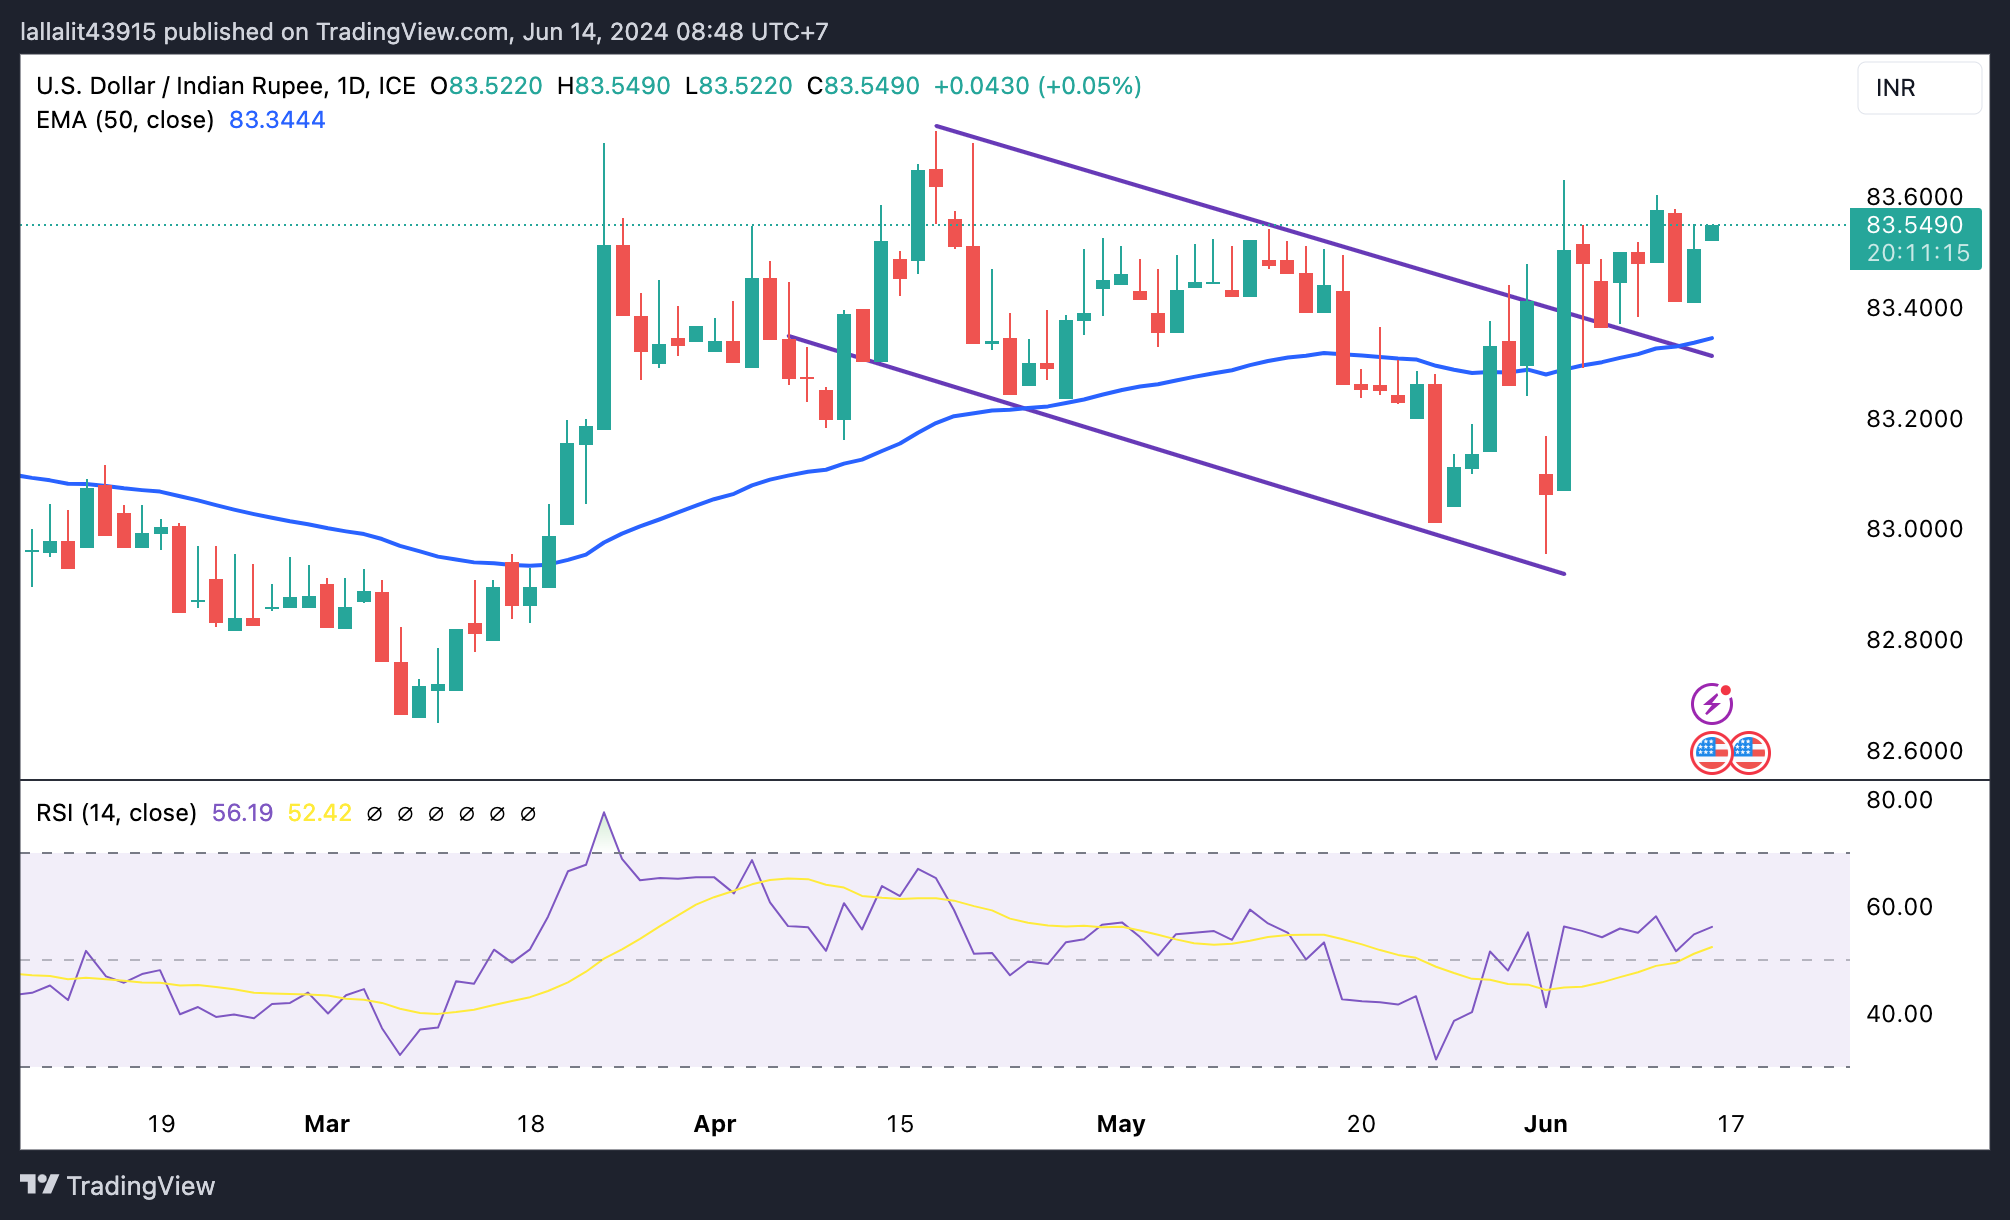
Technical analysis: USD/INR maintains its uptrend in the longer term
The Indian Rupee trades on a softer note on the day. The USD/INR pair has been making higher highs and higher lows since the start of June while holding above the key 100-day Exponential Moving Average (EMA) and descending trend channel upper boundary on the daily timeframe. This indicates that the path of least resistance is to the upside. The 14-day Relative Strength Index (RSI) remains in the bullish zone around 55.50, supporting the buyers for the time being.
If the pair continues to see bullish demand, the first upside barrier will emerge at 83.60, a high of June 11. Then, USD/INR may extend its upswing to 83.72, a high of April 17. Further north, the additional upside filter to watch is the 84.00 round mark.
The crucial support level for the pair is seen in the 83.30–83.35 zone, portraying the confluence of the 100-day EMA and descending trend channel upper boundary. A break below this level could see a drop to the 83.00 psychological level, followed by 82.78, a low of January 15.
US Dollar price in the last 7 days
The table below shows the percentage change of US Dollar (USD) against listed major currencies in the last 7 days. US Dollar was the strongest against the Euro.
| USD | EUR | GBP | CAD | AUD | JPY | NZD | CHF | |
| USD | 1.61% | 0.43% | 0.58% | 0.69% | 1.30% | 0.86% | 0.45% | |
| EUR | -1.63% | -1.15% | -1.04% | -0.92% | -0.23% | -0.74% | -1.16% | |
| GBP | -0.48% | 1.13% | 0.11% | 0.21% | 0.85% | 0.39% | -0.03% | |
| CAD | -0.57% | 1.03% | -0.13% | 0.12% | 0.75% | 0.30% | -0.13% | |
| AUD | -0.71% | 0.90% | -0.24% | -0.12% | 0.69% | 0.18% | -0.24% | |
| JPY | -1.36% | 0.20% | -0.94% | -0.85% | -0.72% | -0.54% | -0.93% | |
| NZD | -0.87% | 0.73% | -0.42% | -0.29% | -0.17% | 0.50% | -0.42% | |
| CHF | -0.43% | 1.14% | 0.00% | 0.13% | 0.24% | 0.92% | 0.41% |
The heat map shows percentage changes of major currencies against each other. The base currency is picked from the left column, while the quote currency is picked from the top row. For example, if you pick the Euro from the left column and move along the horizontal line to the Japanese Yen, the percentage change displayed in the box will represent EUR (base)/JPY (quote).


