
- The Australian Dollar declined despite the higher-than-expected Employment Change.
- Australia’s Unemployment Rate dropped to 4.0% from April’s 4.1% rate, as expected.
- The US Dollar recovered losses as FOMC left its benchmark lending rate in a range of 5.25%–5.50% for the seventh time in a row.
The Australian Dollar (AUD) edges lower despite the employment data release on Thursday. Australia’s Employment Change showed that the number of employed people increased by 39.7K in May, exceeding the expected 30.0K increase and the previous 38.5K rise. Meanwhile, the Unemployment Rate came in at 4.0%, below April’s 4.1% rate as expected.
The US Dollar (USD) recovered its recent losses after the hawkish hold from the US Federal Reserve (Fed), undermining the AUD/USD pair. Investors await the US weekly Initial Jobless Claims and Producer Prices Index (PPI) on Thursday to gain further impetus on economic conditions in the United States (US).
The Federal Open Market Committee (FOMC) left its benchmark lending rate in a range of 5.25%–5.50% for the seventh time in a row at its June meeting on Wednesday, as widely expected.
Daily Digest Market Movers: Australian Dollar inches lower as Fed maintains a hawkish stance
- In a press conference post Fed decision, Fed Chair Jerome Powell noted that the restrictive stance on monetary policy is having the effect on inflation that the central bank had expected. Additionally, FOMC policymakers expect just one rate cut this year, down from three in March.
- US Consumer Price Index (CPI) rose 3.3% YoY in May, compared to the previous reading and the expectations of 3.4%. The core CPI, excluding volatile food and energy prices, increased 3.4% YoY in May, compared to a 3.6% rise in April and the estimation of 3.5%.
- On Wednesday, China’s CPI increased by 0.3% year-over-year in May, missing expectations for a 0.4% rise. Inflation decreased by 0.1% MoM versus April’s 0.1% increase.
- Australian Treasurer Jim Chalmers stated that the visit of China's Premier Li Qiang to Australia is an important opportunity. Chalmers noted underlying weaknesses in China's economy and expressed that he does not expect China's economy to recover immediately.
- Australia's NAB Business Confidence index dropped to -3 index points in May, marking the lowest figure in six months and turning negative for the first time since last November. Meanwhile, Business Conditions fell to 6 index points, slightly below the long-run average.
- On Tuesday, National Australia Bank (NAB) Chief Economist Alan Oster commented, “There are warning signs on the outlook for growth but at the same time reasons to be very wary about the inflation outlook, and they expect the RBA to keep rates on hold for some time yet as they navigate through these contrasting risks,” as per the official transcript.
- Last week, RBA Governor Michele Bullock indicated that the central bank is prepared to increase interest rates if the Consumer Price Index (CPI) does not return to the target range of 1%-3%, according to NCA NewsWire.
Technical Analysis: Australian Dollar hovers around 0.6650
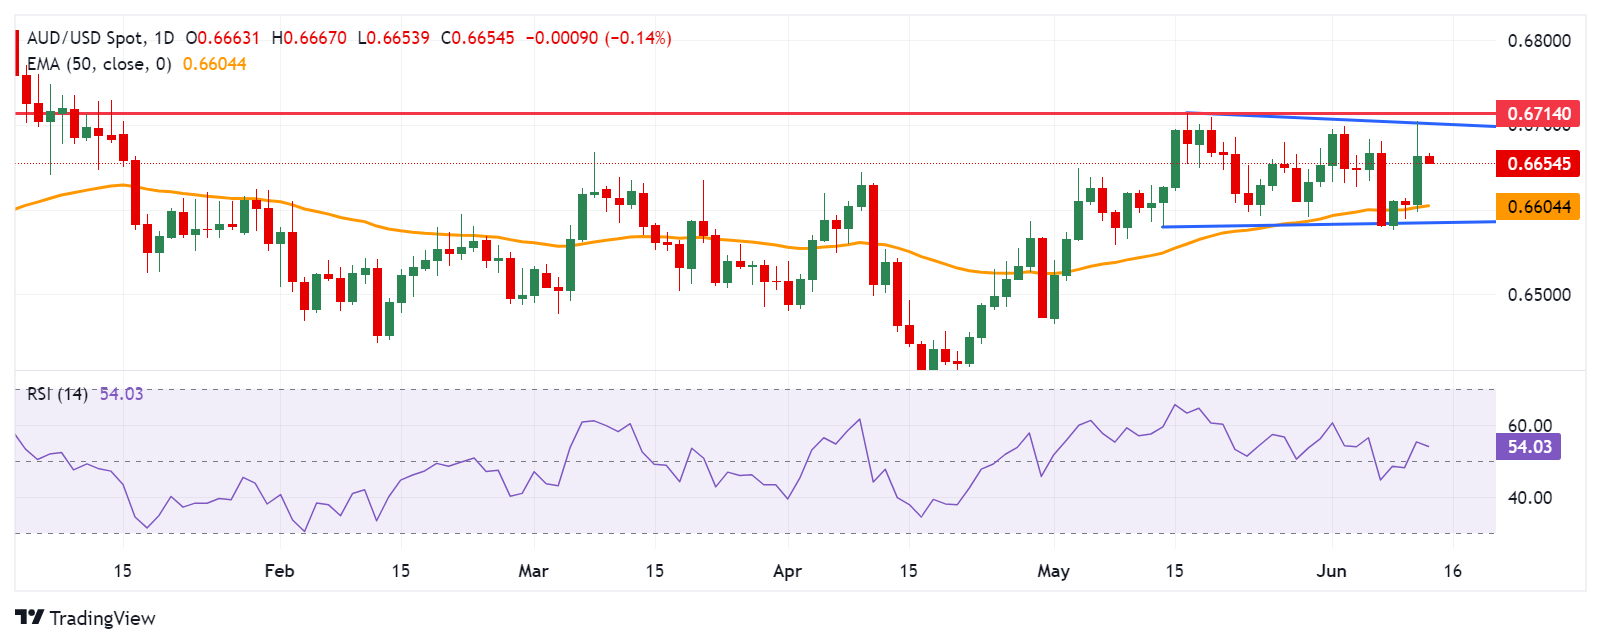
The Australian Dollar trades around 0.6660 on Thursday. Analysis of the daily chart indicates a neutral bias for the AUD/USD pair as it consolidates within the rectangle formation. The 14-day Relative Strength Index (RSI) is positioned slightly below the 50 level. A further movement may suggest a clear directional trend.
Immediate support region is identified around the 50-day Exponential Moving Average (EMA) at 0.6604, followed by the lower boundary of the rectangle formation around the level of 0.6585.
On the upside, the AUD/USD pair could explore the region around the upper threshold of the rectangle formation around the level of 0.6700, followed by May’s high of 0.6714.
AUD/USD: Daily Chart
Australian Dollar price today
The table below shows the percentage change of the Australian Dollar (AUD) against listed major currencies today. The Australian Dollar was the weakest against the US Dollar.
| USD | EUR | GBP | CAD | AUD | JPY | NZD | CHF | |
| USD | 0.09% | 0.14% | 0.19% | 0.26% | 0.23% | 0.31% | 0.15% | |
| EUR | -0.09% | 0.05% | 0.11% | 0.18% | 0.17% | 0.23% | 0.09% | |
| GBP | -0.16% | -0.06% | 0.04% | 0.10% | 0.08% | 0.16% | 0.00% | |
| CAD | -0.19% | -0.10% | -0.04% | 0.05% | 0.03% | 0.12% | -0.03% | |
| AUD | -0.26% | -0.17% | -0.10% | -0.05% | -0.02% | 0.07% | -0.10% | |
| JPY | -0.23% | -0.16% | -0.06% | -0.02% | 0.01% | 0.08% | -0.06% | |
| NZD | -0.32% | -0.23% | -0.18% | -0.13% | -0.07% | -0.10% | -0.18% | |
| CHF | -0.17% | -0.07% | -0.01% | 0.04% | 0.08% | 0.07% | 0.15% |
The heat map shows percentage changes of major currencies against each other. The base currency is picked from the left column, while the quote currency is picked from the top row. For example, if you pick the Euro from the left column and move along the horizontal line to the Japanese Yen, the percentage change displayed in the box will represent EUR (base)/JPY (quote).


