
- Indian Rupee struggles to gain ground on the USD demand on Thursday.
- The hawkish hold by the Fed supported the Greenback, but the RBI intervention might limit the pair’s upside.
- The US weekly Initial Jobless Claims, Producer Prices Index (PPI), and Fed’s John Williams speech will be in focus on Thursday.
Indian Rupee (INR) weakens on Thursday amid the persistent US Dollar (USD) demand from local oil companies and other importers. The hawkish hold by the US Federal Reserve (Fed) helped the Greenback to regain some composure despite the release of softer-than-expected US May inflation data. The INR encounters a push-pull dynamic driven by multiple market factors. Nonetheless, the foreign exchange (FX) intervention from the Reserve Bank of India (RBI) might curb the Indian Rupee's decline for the time being.
Traders will watch the US weekly Initial Jobless Claims, Producer Prices Index (PPI), and Fed’s John Williams speech, which are due later on Thursday. On Friday, the preliminary US Michigan Consumer Sentiment Index for June will be released. The highlight on Friday will be India’s Wholesale Price Index (WPI) Inflation data. The hotter-than-expected consumer inflation might lift the Indian Rupee and cap the upside for the pair in the near term.
Daily Digest Market Movers: Indian Rupee loses ground amid various factors
- India's CPI inflation eased to a 12-month low of 4.75% in May, compared to 4.83% in April, which is softer than the market expectation of 4.90%.
- The US headline Consumer Price Index (CPI) inflation eased to 3.3% on a yearly basis in May from 3.4% in April, below the market consensus of 3.4%.
- The core CPI figure, which excludes volatile food and energy prices, rose 3.4%, compared to a 3.6% rise in April and the estimation of 3.5%. On a monthly basis, the core CPI increased 0.2% in May.
- The Federal Open Market Committee (FOMC) decided to keep its benchmark lending rate in a range of 5.25%–5.50% for the seventh time in a row at its June meeting on Wednesday.
- The so-called ‘dot-plot’ showed that the median of FOMC officials revised their forecast of the federal funds rate from 4.6% to 5.1% toward the end of 2024.
- Fed Chair Jerome Powell said on Wednesday during the press conference that the restrictive stance on monetary policy is affecting inflation, which the Fed had hoped to see, but the central bank will wait to see sufficient progress on inflation.
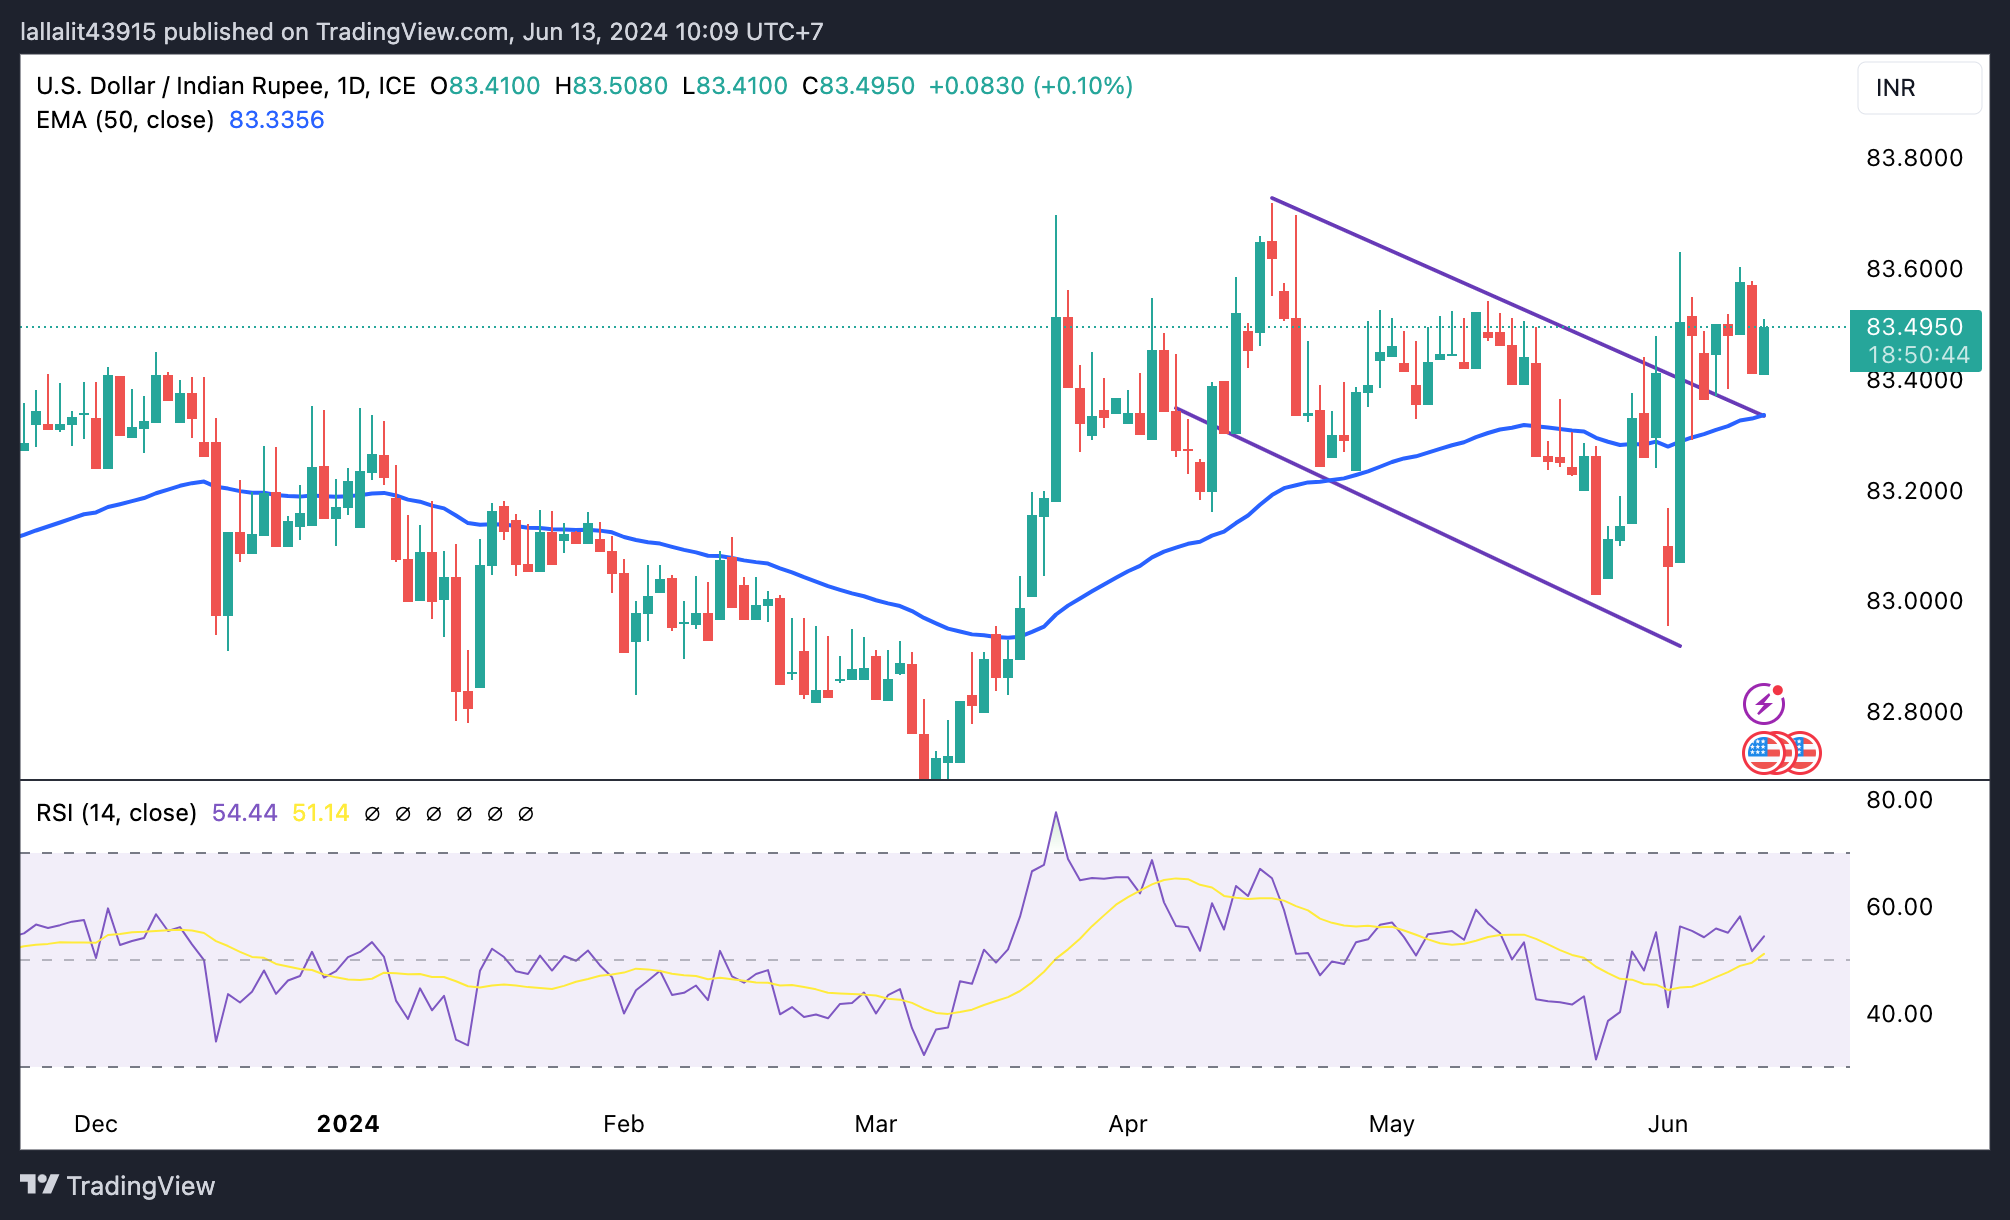
Technical analysis: USD/INR displays a bullish vibe in the longer term
The Indian Rupee trades in negative territory on the day. The constructive outlook of the USD/INR pair remains intact as the pair holds above the key 100-day Exponential Moving Average (EMA) and descending trend channel upper boundary on the daily timeframe.
USD/INR is likely to extend the consolidative mode in the near term as the 14-day Relative Strength Index (RSI) still hovers around the 50-midline, indicating the neutral momentum of the pair.
In the bullish event, the immediate upside barrier is located at 83.60, a high of June 11. Then, the pair could extend its upswing to 83.72, a high of April 17. The next hurdle will emerge at the 84.00 round mark.
A break below the crucial support at 83.35, the confluence of the 100-day EMA and descending trend channel upper boundary, could mark the start of a reversal from the uptrend. The next contention level is seen at the 83.00 psychological level, followed by 82.78, a low of January 15.
US Dollar price this week
The table below shows the percentage change of US Dollar (USD) against listed major currencies this week. US Dollar was the strongest against the Japanese Yen.
| USD | EUR | GBP | CAD | AUD | JPY | NZD | CHF | |
| USD | -0.24% | -0.39% | -0.09% | -0.93% | 0.23% | -1.01% | -0.08% | |
| EUR | 0.23% | -0.16% | 0.14% | -0.69% | 0.46% | -0.78% | 0.15% | |
| GBP | 0.39% | 0.16% | 0.30% | -0.53% | 0.63% | -0.63% | 0.32% | |
| CAD | 0.09% | -0.14% | -0.30% | -0.83% | 0.34% | -0.92% | 0.00% | |
| AUD | 0.94% | 0.72% | 0.55% | 0.83% | 1.15% | -0.08% | 0.84% | |
| JPY | -0.23% | -0.46% | -0.63% | -0.33% | -1.17% | -1.26% | -0.33% | |
| NZD | 1.00% | 0.77% | 0.61% | 0.91% | 0.08% | 1.23% | 0.91% | |
| CHF | 0.09% | -0.15% | -0.31% | 0.00% | -0.84% | 0.32% | -0.93% |
The heat map shows percentage changes of major currencies against each other. The base currency is picked from the left column, while the quote currency is picked from the top row. For example, if you pick the Euro from the left column and move along the horizontal line to the Japanese Yen, the percentage change displayed in the box will represent EUR (base)/JPY (quote).


