
Most recent article: Stock Market Today: Nifty tanks 4%, with India’s election vote count underway
- Indian Rupee trades with negative bias on Tuesday.
- The uncertainty surrounding India's general election results and key US data weighs on the INR.
- India’s HSBC Services PMI and US ISM Services PMI for May will be released on Wednesday.
Indian Rupee (INR) weakens on Tuesday despite the softer US Dollar (USD). The INR trims gains as investors await more clarity about India's official general election outcome. Early vote counting trends indicate that Prime Minister Narendra Modi's Bharatiya Janata Party (BJP) is unlikely to win a decisive majority, as projected by exit polls over the weekend. However, a third consecutive win for the BJP-led government might boost investor confidence and lift the Indian Rupee. Furthermore, risk appetite and a decline in crude oil prices continue to underpin the INR as India is the third-largest oil consumer in the world.
India’s HSBC Services Purchasing Managers Index (PMI) and US ISM Services PMI for May will be published on Wednesday. The highlight of this week will be the Reserve Bank of India's (RBI) monetary policy and the US Nonfarm Payrolls later on Friday. The stronger-than-expected US economic data might provide some support to the Greenback and cap the downside for the pair.
Daily Digest Market Movers: Indian Rupee weakens as NDA still below 300 seat threshold
- Early trends show India’s Prime Minister Narendra Modi's BJP is leading in just under 300 seats, while opposition parties are ahead in about 200, per BBC.
- Most exit polls projected the alliance led by Modi's Bharatiya Janata Party (BJP) would win 303 seats in the 543-member lower house and likely get a two-thirds majority, enough to initiate amendments to the constitution, per Reuters.
- HDFC Securities FX research analyst, Dilip Parmar, said that the Indian rupee should gain "as we will see dollar inflows on foreign funds buying domestic equities and debt.”
- The Indian HSBC Manufacturing PMI dropped to 57.5 in May, compared to the previous reading and the market consensus of 58.4.
- The US ISM Manufacturing PMI declined to 48.7 in May from the previous reading of 49.2, weaker than the market expectation of 49.6.
- The US Nonfarm Payrolls (NFP) is estimated to see 190,000 job additions in May.
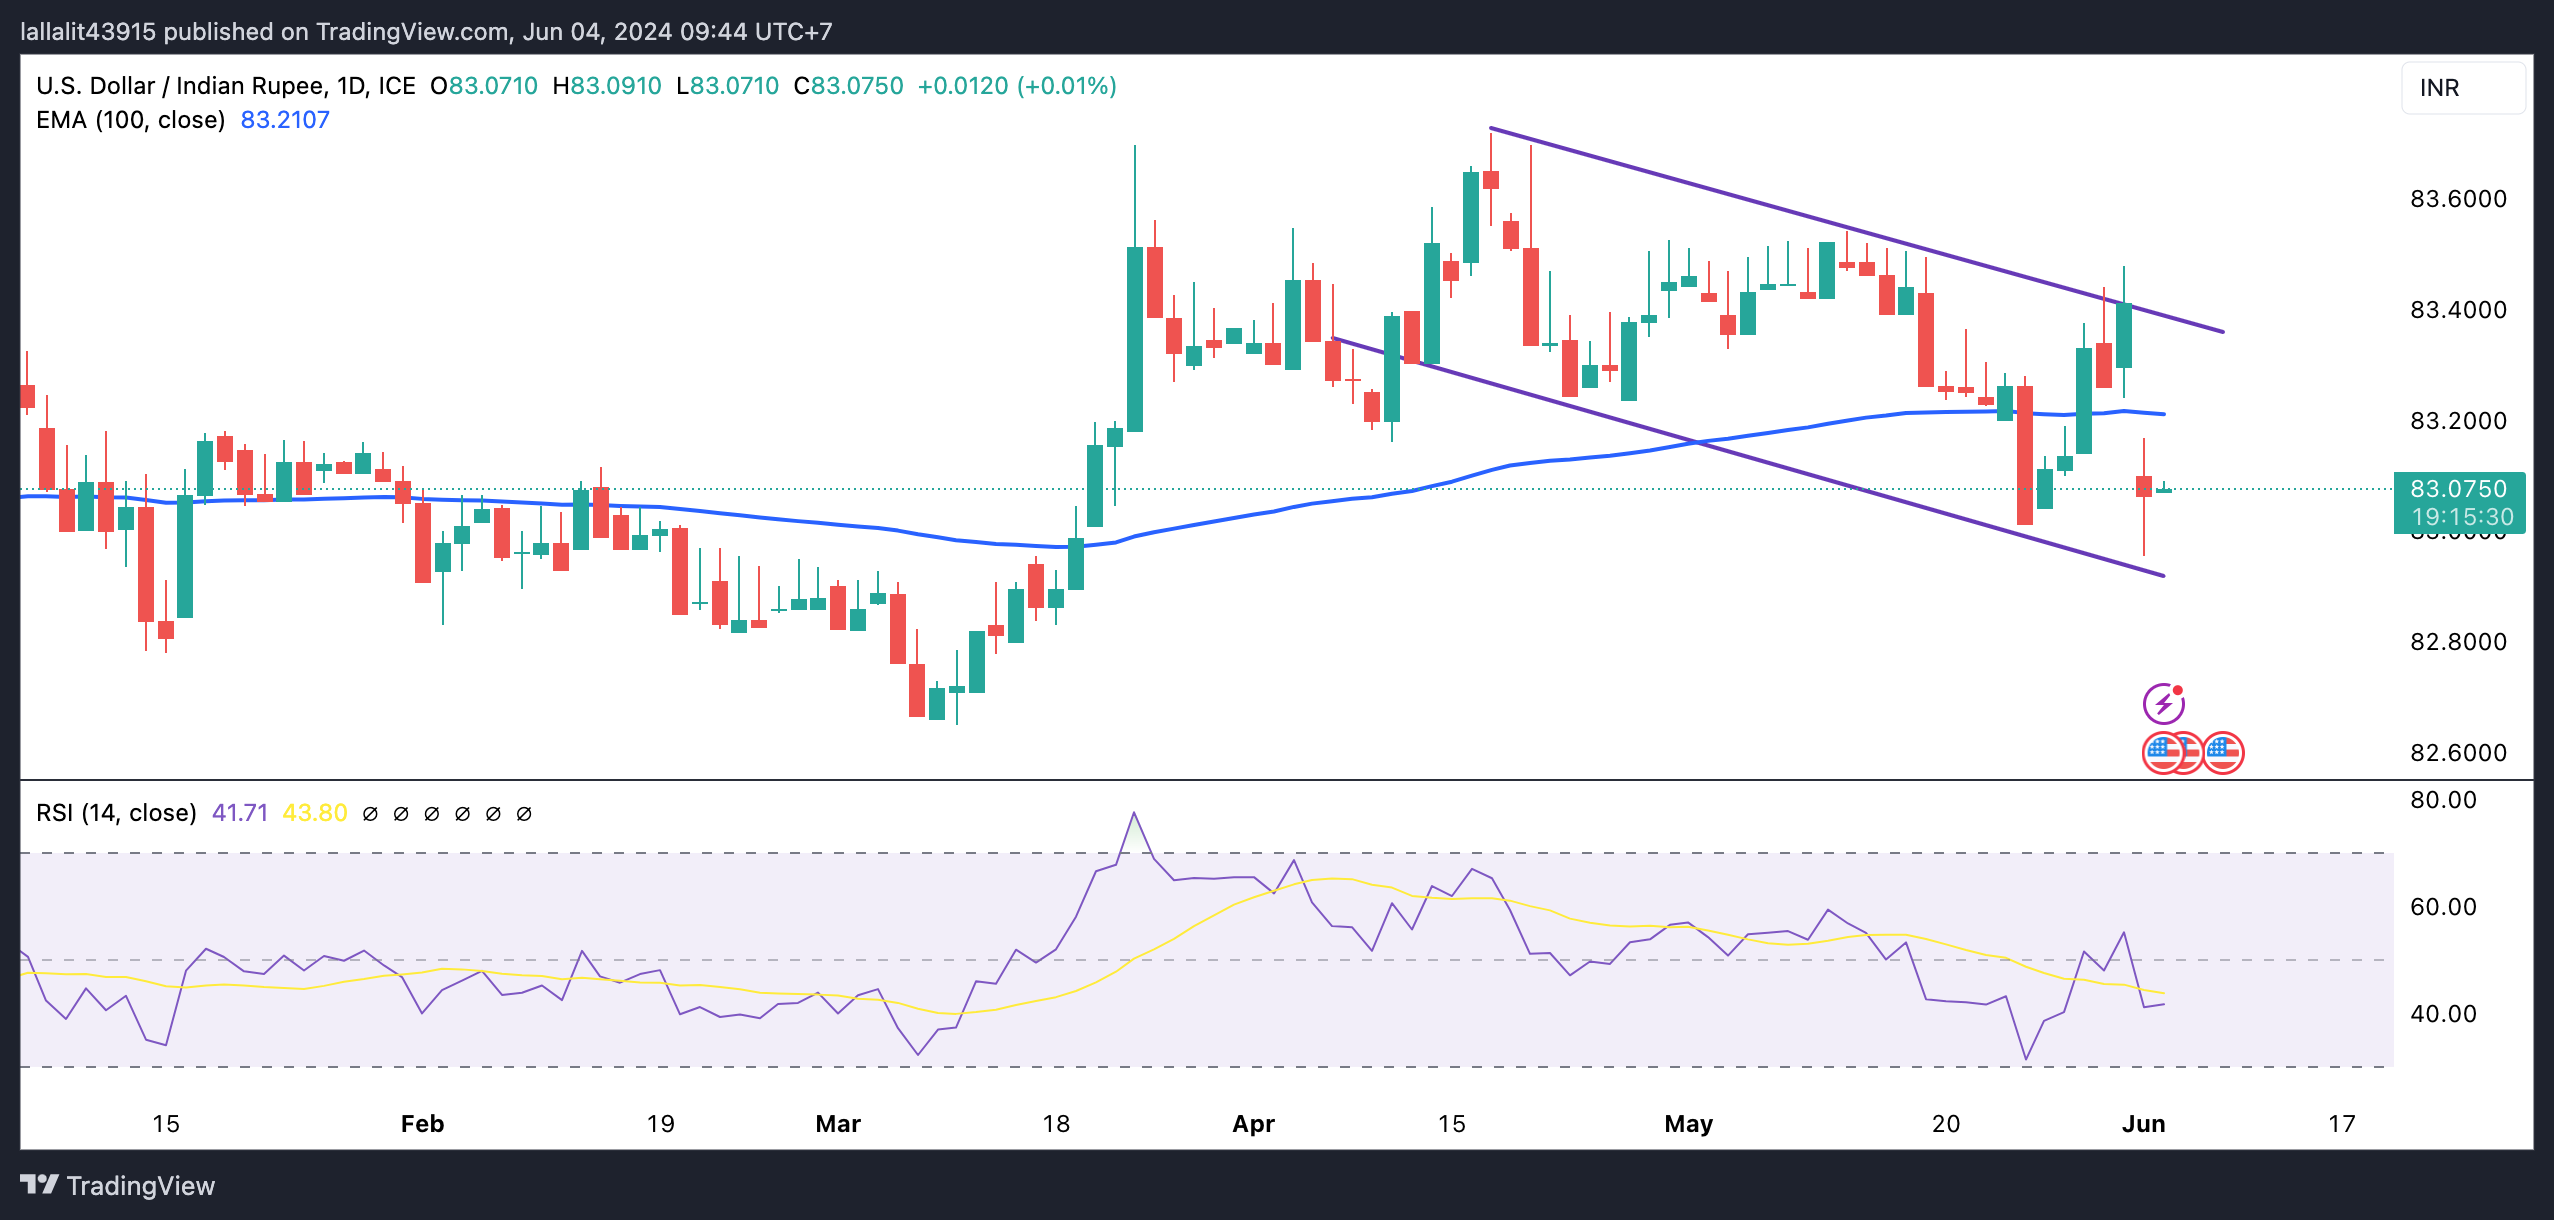
Technical analysis: USD/INR resumes bearish outlook
The Indian Rupee trades softer on the day. The USD/INR pair turns bearish on the daily timeframe as the pair crosses below the key 100-day Exponential Moving Average (EMA) and the 14-day Relative Strength Index (RSI) remains capped below the 50-midline, suggesting the further downside looks favorable for the time being.
The potential support level for the pair will emerge at the 82.90–83.00 region, portraying the lower limit of a descending trend channel that has been established since mid-April and the psychological mark. A decisive break below this level will see a drop to a low of January 15 at 82.78, followed by a low of March 8 at 82.65.
On the upside, the first upside barrier is located near the 100-day EMA at 83.20. Any follow-through buying above the mentioned level will pave the way to the upper boundary of the descending trend channel at 83.40. Further north, the next hurdle is seen near a high of April 17 at 83.72 en route to the 84.00 psychological mark.
US Dollar price today
The table below shows the percentage change of US Dollar (USD) against listed major currencies today. US Dollar was the strongest against the Australian Dollar.
| USD | EUR | GBP | CAD | AUD | JPY | NZD | CHF | |
| USD | 0.12% | 0.11% | 0.20% | 0.35% | -0.26% | 0.17% | 0.07% | |
| EUR | -0.12% | -0.01% | 0.08% | 0.23% | -0.38% | 0.05% | -0.05% | |
| GBP | -0.12% | 0.01% | 0.09% | 0.25% | -0.37% | 0.06% | -0.04% | |
| CAD | -0.20% | -0.08% | -0.08% | 0.16% | -0.46% | -0.02% | -0.12% | |
| AUD | -0.35% | -0.24% | -0.25% | -0.15% | -0.63% | -0.18% | -0.29% | |
| JPY | 0.20% | 0.37% | 0.36% | 0.40% | 0.59% | 0.38% | 0.33% | |
| NZD | -0.14% | -0.02% | -0.03% | 0.06% | 0.22% | -0.40% | -0.07% | |
| CHF | -0.06% | 0.05% | 0.04% | 0.13% | 0.27% | -0.33% | 0.10% |
The heat map shows percentage changes of major currencies against each other. The base currency is picked from the left column, while the quote currency is picked from the top row. For example, if you pick the Euro from the left column and move along the horizontal line to the Japanese Yen, the percentage change displayed in the box will represent EUR (base)/JPY (quote).


