
- The Australian Dollar edges lower due to investors' caution ahead of ISM Manufacturing PMI.
- Australian minimum wage increased by 3.75%, aligning with the expected range of 3.50%-4.00%.
- The US Dollar has trimmed its daily losses as US Treasury yields improve.
The Australian Dollar (AUD) depreciates as investors turn cautious ahead of the ISM Manufacturing PMI release on Monday. During the early hours of the Asian session, AUD received support as the minimum wage increased by 3.75% in Australia, aligning with market estimates that ranged from 3.5% to 4.0%. Additionally, the AUD/USD pair strengthened as the US Personal Consumption Expenditure (PCE) data, the Federal Reserve's preferred measure of inflation, showed that price pressures eased in April. Moreover, Australia's monthly inflation rate also accelerated to 3.6%, increasing the likelihood that the Reserve Bank of Australia (RBA) might need to raise interest rates again.
The Australian Dollar also benefited from the Caixin Manufacturing Purchasing Managers Index (PMI) in China, which posted a higher-than-expected reading for May. However, on Friday, lower-than-expected NBS PMI data from China dented import demand for Australia, a top commodity producer. Given the close trade relationship between Australia and China, any changes in the Chinese economy can significantly impact the Australian market.
The US Dollar (USD) edges higher as US Treasury yields improve, which could be attributed to the risk aversion sentiment. The Greenback could struggle as Federal Reserve (Fed) officials indicated last week that the central bank may reach its 2% annual inflation target without further interest rate hikes. Investors are likely awaiting the US Nonfarm Payrolls report on Friday.
Daily Digest Market Movers: Australian Dollar edges lower due to investors' caution
- Australia’s Judo Bank Manufacturing PMI released on Monday, edging up slightly to 49.7 in May from 49.6 in April, marking the fourth consecutive month of declining conditions in the manufacturing sector.
- On Monday, the Caixin China Manufacturing PMI rose to 51.7 in May from 51.4 in April, marking the seventh consecutive month of expansion in factory activity and surpassing the estimates of 51.5. Friday’s NBS PMI data showed that manufacturing activity fell to 49.5 in May from 50.4 in April, missing the market consensus of an increase to 50.5. Meanwhile, the Non-Manufacturing PMI declined to 51.1 from the previous reading of 51.2, falling short of the estimated 51.5.
- On Friday, the US PCE Index rose 0.3% MoM and 2.7% YoY in April, matching the expectations. The Core PCE, excluding the volatile food and energy, climbed 0.2% MoM in April, lower than the expected 0.3% rise. On an annual basis, the index jumped 2.8% as expected.
- On Thursday, Atlanta Fed President Raphael Bostic remarked in an interview with Fox Business that he doesn't believe further rate hikes should be required to reach the Fed's 2% annual inflation target. Additionally, New York Fed President John Williams stated that inflation is still too high but should moderate over the second half of 2024. Williams doesn't feel the urgency to act on monetary policy.
- As per a Bloomberg report, RBA Assistant Governor Sarah Hunter said at a conference in Sydney on Thursday that “inflationary pressures" are the key issue. “We’re very mindful of that." Hunter also stated that the RBA Board is concerned about inflation remaining above the target range of 1%-3%, suggesting persistent inflationary pressure. Wages growth appears to be near its peak.
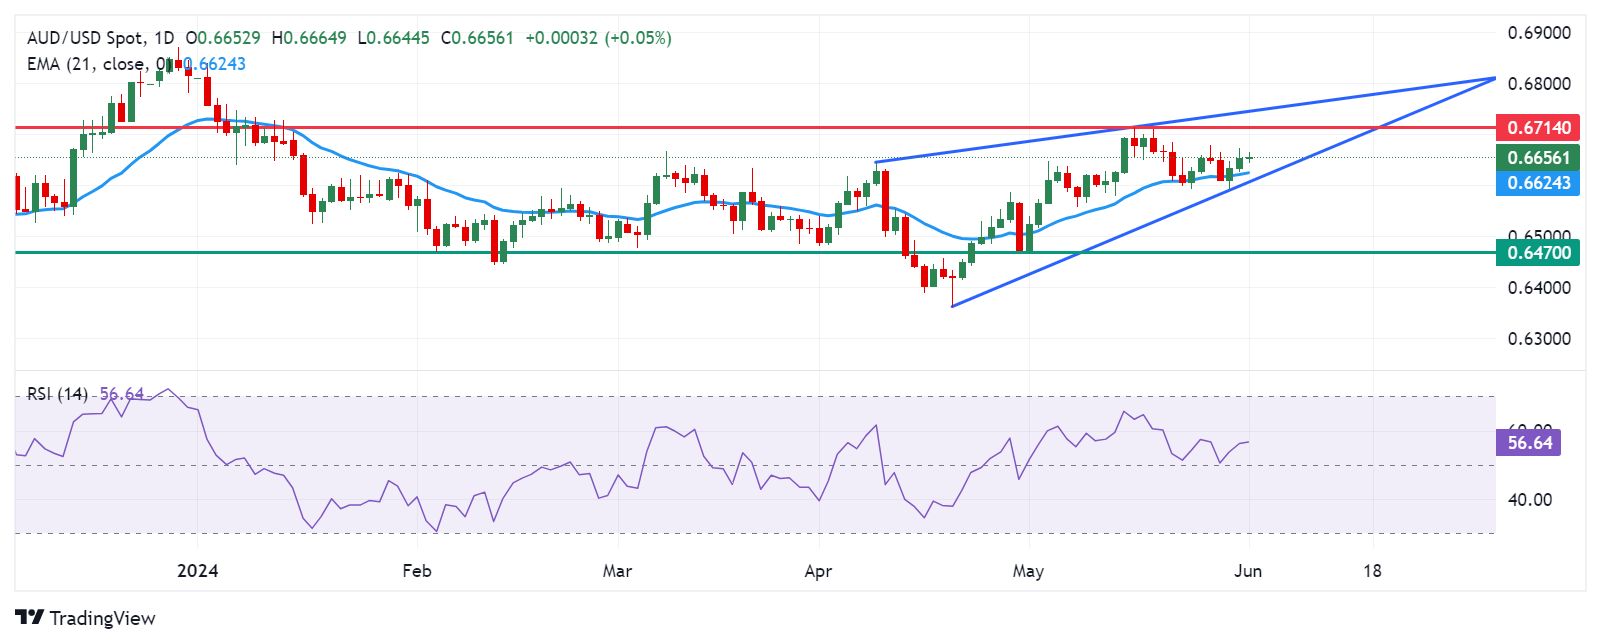
Technical Analysis: Australian Dollar remains above 0.6650
The Australian Dollar traded around 0.6660 on Monday. A daily chart analysis suggests a bullish bias for the AUD/USD pair, as it appears to be moving upward from the lower boundary of a rising wedge pattern. Furthermore, the 14-day Relative Strength Index (RSI) is positioned above the 50 level, confirming this bullish bias.
The AUD/USD pair could aim for the psychological level of 0.6700, followed by the four-month high of 0.6714 and the upper limit of the rising wedge around 0.6750.
On the downside, immediate support is seen at the 21-day Exponential Moving Average (EMA) at 0.6624, followed by the psychological level of 0.6600 around the lower boundary of the rising wedge. Further decline might exert downward pressure on the AUD/USD pair, potentially leading it toward the throwback support region at 0.6470.
AUD/USD: Daily Chart
Australian Dollar price today
The table below shows the percentage change of the Australian Dollar (AUD) against listed major currencies today. The Australian Dollar was the weakest against the US Dollar.
| USD | EUR | GBP | CAD | AUD | JPY | NZD | CHF | |
| USD | 0.04% | 0.14% | 0.25% | 0.27% | 0.02% | 0.19% | 0.14% | |
| EUR | -0.04% | 0.09% | 0.22% | 0.22% | 0.00% | 0.15% | 0.12% | |
| GBP | -0.14% | -0.10% | 0.12% | 0.12% | -0.11% | 0.05% | 0.02% | |
| CAD | -0.25% | -0.22% | -0.12% | -0.01% | -0.23% | -0.06% | -0.10% | |
| AUD | -0.27% | -0.22% | -0.12% | 0.01% | -0.21% | -0.06% | -0.10% | |
| JPY | -0.02% | 0.02% | 0.10% | 0.21% | 0.21% | 0.16% | 0.11% | |
| NZD | -0.18% | -0.15% | -0.05% | 0.07% | 0.08% | -0.16% | -0.04% | |
| CHF | -0.14% | -0.12% | -0.02% | 0.10% | 0.10% | -0.12% | 0.04% |
The heat map shows percentage changes of major currencies against each other. The base currency is picked from the left column, while the quote currency is picked from the top row. For example, if you pick the Euro from the left column and move along the horizontal line to the Japanese Yen, the percentage change displayed in the box will represent EUR (base)/JPY (quote).


