
Most recent article: 2024 Indian election: Continuity expected as Modi looks set to win third term
- Indian Rupee rebounds on Monday on the softer USD.
- The Indian HSBC Manufacturing PMI dropped to 57.5 in May from 58.4 in April.
- The success of Narendra Modi's (BJP) third-term election might boost the INR.
- The final reading on Indian and US Manufacturing PMI for May will be in the spotlight on Monday.
Indian Rupee (INR) recovers on Monday amid the weaker US dollar (USD). On Friday, the INR closed the week with its worst weekly performance in over two months, pressured by month-end USD demand from importers. However, the decline of the INR might be limited as the Reserve Bank of India (RBI) is likely to intervene in the local currency from depreciation. The recent economic data showed that India’s Manufacturing Purchasing Managers Index (PMI) for May came in weaker than expected, dropping to 57.5 from 58.4 in April.
However, the downbeat Indian PMI data had little to no impact on the INR as investors await India's general election outcome, with vote counting on June 4. Analysts expect the Indian Rupee to rally this week as exit polls revealed Prime Minister Narendra Modi's Bharatiya Janata Party would win a third term.
On the US docket, the ISM Manufacturing PMI will be released. The stronger-than-expected reading might dampen the expectation of the Federal Reserve (Fed) rate cut this year and boost the Greenback.
Daily Digest Market Movers: Indian Rupee gains momentum ahead of India's general election result
- Indian equity benchmark indices opened at a record high on Monday with the Nifty 50 up 3.58% or 807.20 points higher at 23,337.70 and Sensex up 2621.98 points, or 3.55% higher at 76,583.30, per the Indian Express.
- The Indian rupee should gain "as we will see dollar inflows on foreign funds buying domestic equities and debt," said HDFC Securities FX research analyst, Dilip Parmar.
- Most exit polls projected the governing NDA would win a two-thirds majority in the 543-member lower house of parliament, where 272 is required for a simple majority.
- The 10-year Indian government bond yield closed Friday at 6.9809%, marking the sixth straight weekly decline and having its biggest monthly loss in four years.
- The US Personal Consumption Expenditures (PCE) Price Index came in as expected, advancing 0.3% on a monthly basis in April and rising 2.7% on a yearly basis.
- The Core PCE, excluding the volatile food and energy, rose 0.2% MoM in April, compared to a 0.3% gain in March. On an annual basis, the core PCE price index climbed 2.8% for the third consecutive month.
- Personal Income rose 0.3% on a monthly basis in April, while Personal Spending grew by 0.2%.
- The US ISM Manufacturing PMI is expected to improve to 49.8 in May from 49.2 in April.
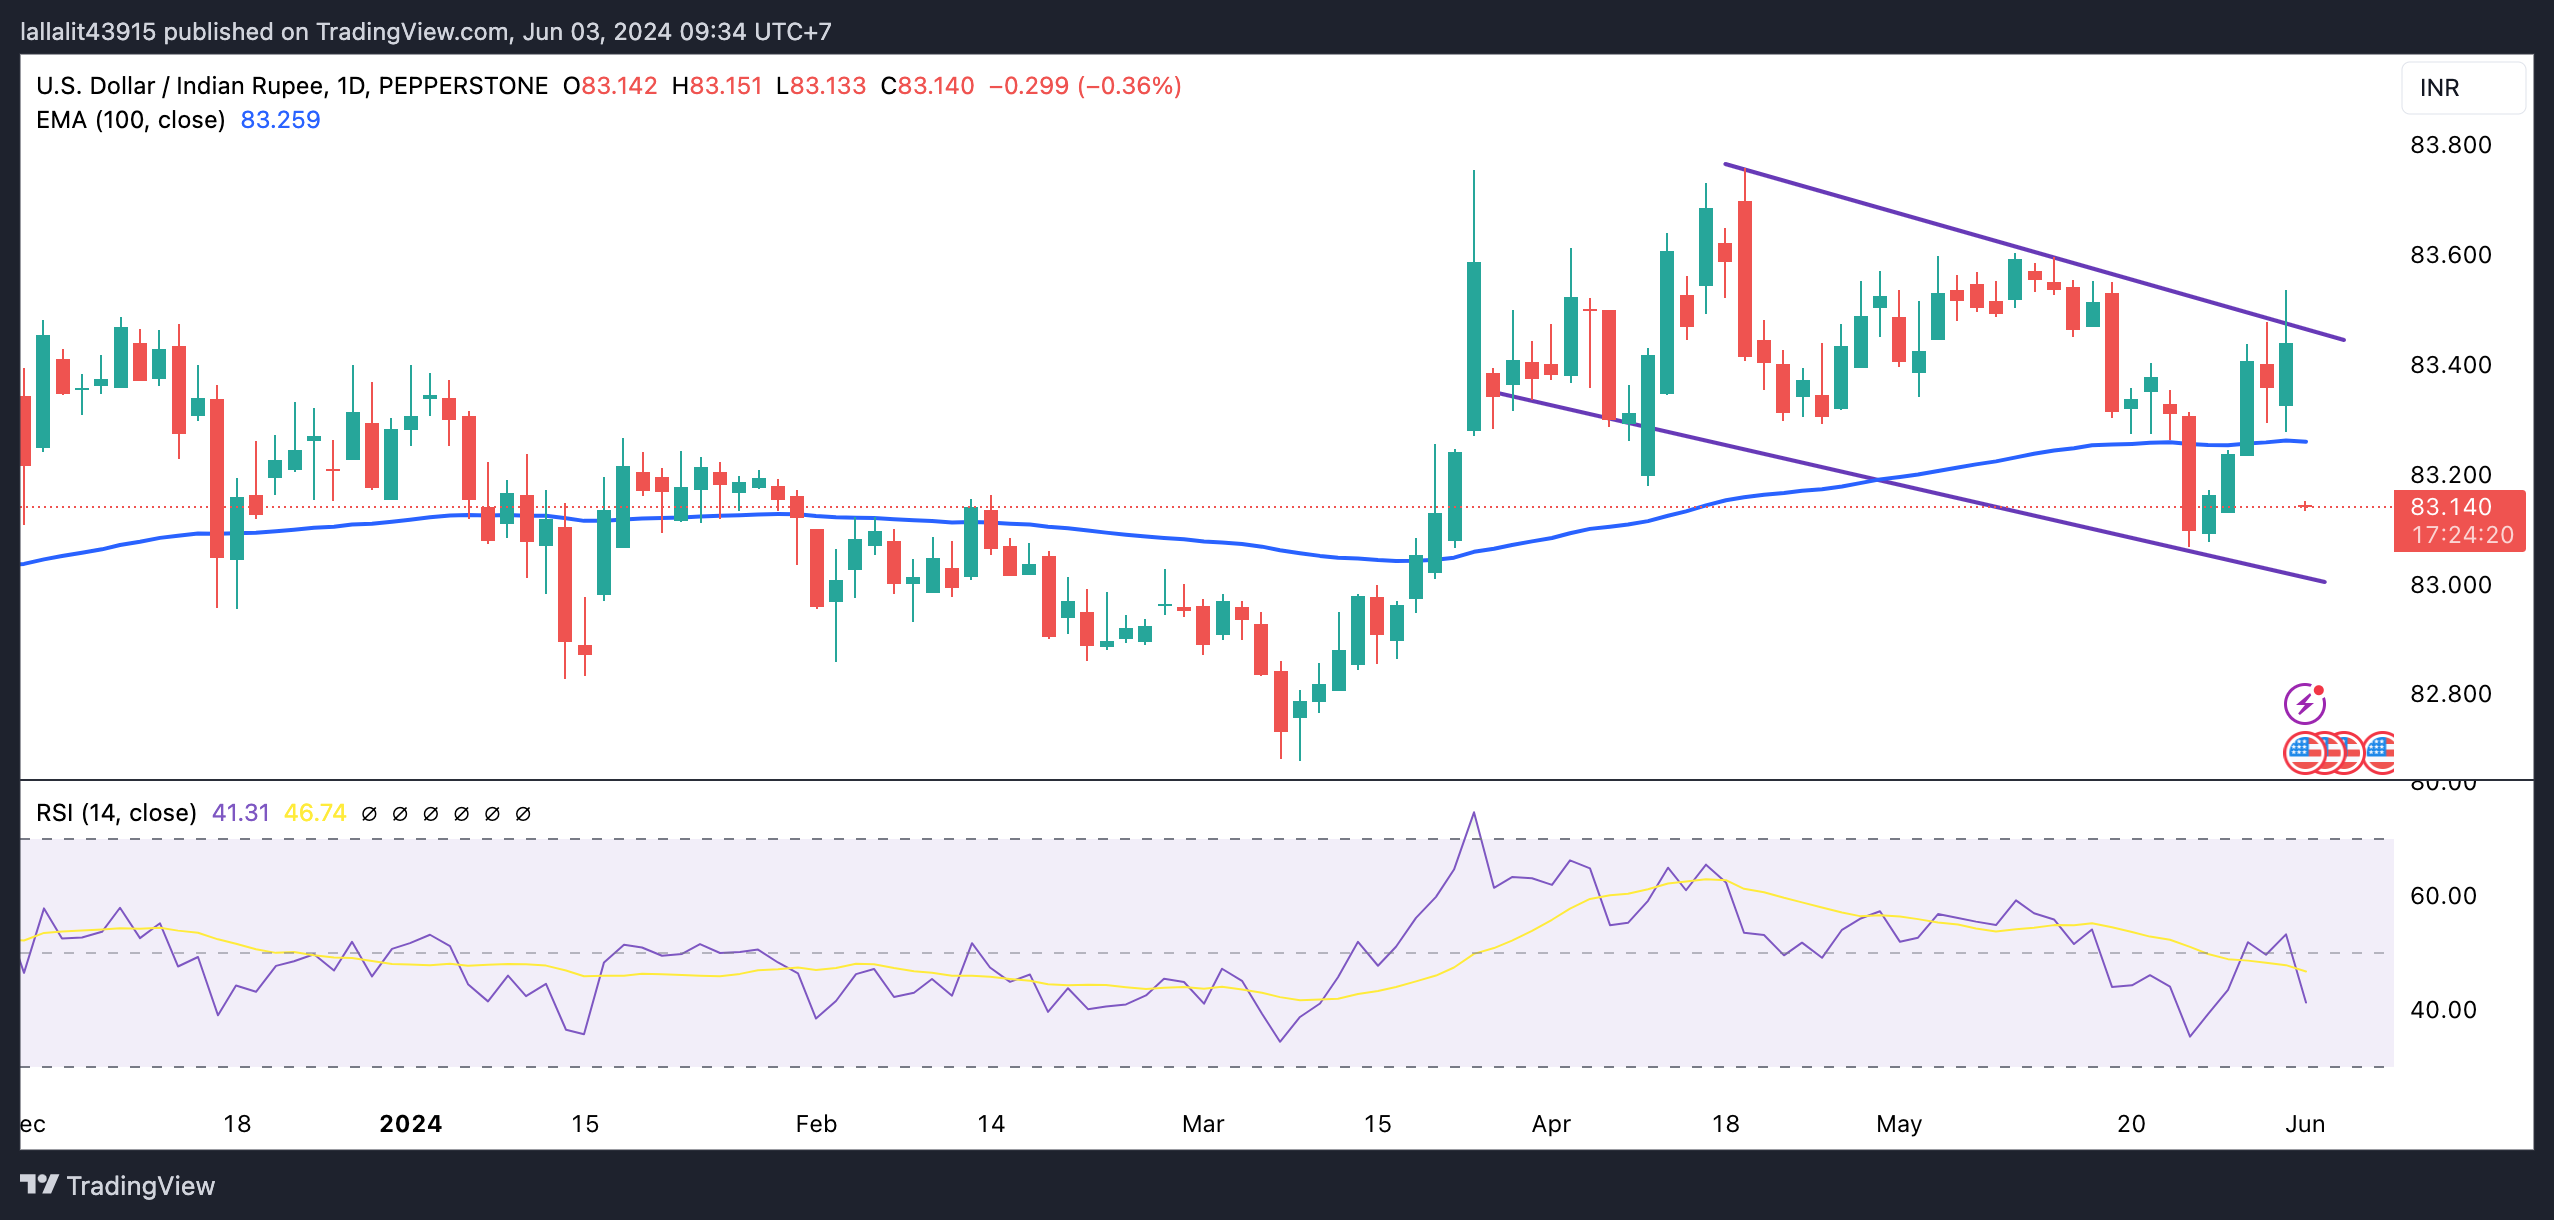
Technical analysis: USD/INR’s bullish outlook prevails
The Indian Rupee trades stronger on the day. The USD/INR pair keeps the bullish vibe above the key 100-day Exponential Moving Average (EMA) on the daily timeframe. The upward momentum is supported by the 14-day Relative Strength Index (RSI), which stands around 55.0, supporting the buyers for the time being.
A decisive break above a descending trend channel that has been established since mid-April at 83.40 will see a rally to 83.54 (high of May 13), followed by 83.72 (high of April 17), and finally at 84.00 (psychological mark).
On the flip side, the 100-day EMA around 83.21 acts as an initial support level for USD/INR. The key contention level to watch is the 83.00 round figure, A breach of the mentioned level could expose 82.78 (low of January 15).
US Dollar price today
The table below shows the percentage change of US Dollar (USD) against listed major currencies today. US Dollar was the weakest against the Euro.
| USD | EUR | GBP | CAD | AUD | JPY | NZD | CHF | |
| USD | -0.01% | 0.06% | 0.17% | 0.23% | 0.05% | 0.18% | 0.07% | |
| EUR | 0.01% | 0.07% | 0.18% | 0.24% | 0.06% | 0.18% | 0.08% | |
| GBP | -0.06% | -0.07% | 0.11% | 0.16% | 0.00% | 0.12% | 0.01% | |
| CAD | -0.17% | -0.18% | -0.11% | 0.06% | -0.11% | 0.01% | -0.09% | |
| AUD | -0.23% | -0.23% | -0.16% | -0.05% | -0.16% | -0.04% | -0.15% | |
| JPY | -0.05% | -0.05% | 0.02% | 0.11% | 0.15% | 0.12% | 0.02% | |
| NZD | -0.16% | -0.19% | -0.12% | 0.02% | 0.06% | -0.11% | -0.09% | |
| CHF | -0.08% | -0.09% | -0.02% | 0.09% | 0.14% | -0.02% | 0.10% |
The heat map shows percentage changes of major currencies against each other. The base currency is picked from the left column, while the quote currency is picked from the top row. For example, if you pick the Euro from the left column and move along the horizontal line to the Japanese Yen, the percentage change displayed in the box will represent EUR (base)/JPY (quote).


