

I. Recent CCL Stock Performance
Carnival Starts A Strong Year in 2024
Carnival has undergone substantial transformations in recent times. The company established several records in its most recent fiscal first-quarter report, which was published in late March. Revenue increased by 23% year-over-year to $5.4 billion, surpassing the pre-pandemic high of $4.7 billion set in the first quarter of 2019.
This growth was driven by higher booking prices and increased capacity from introducing new ships. In the first quarter, adjusted earnings before interest, taxes, depreciation, and amortization (EBITDA) increased from $382 million in the corresponding period of the previous year to $871 million.
Currently, cruising is more popular than ever, and Carnival's numerous brands are experiencing robust demand.
CCL Customer Deposit Soared
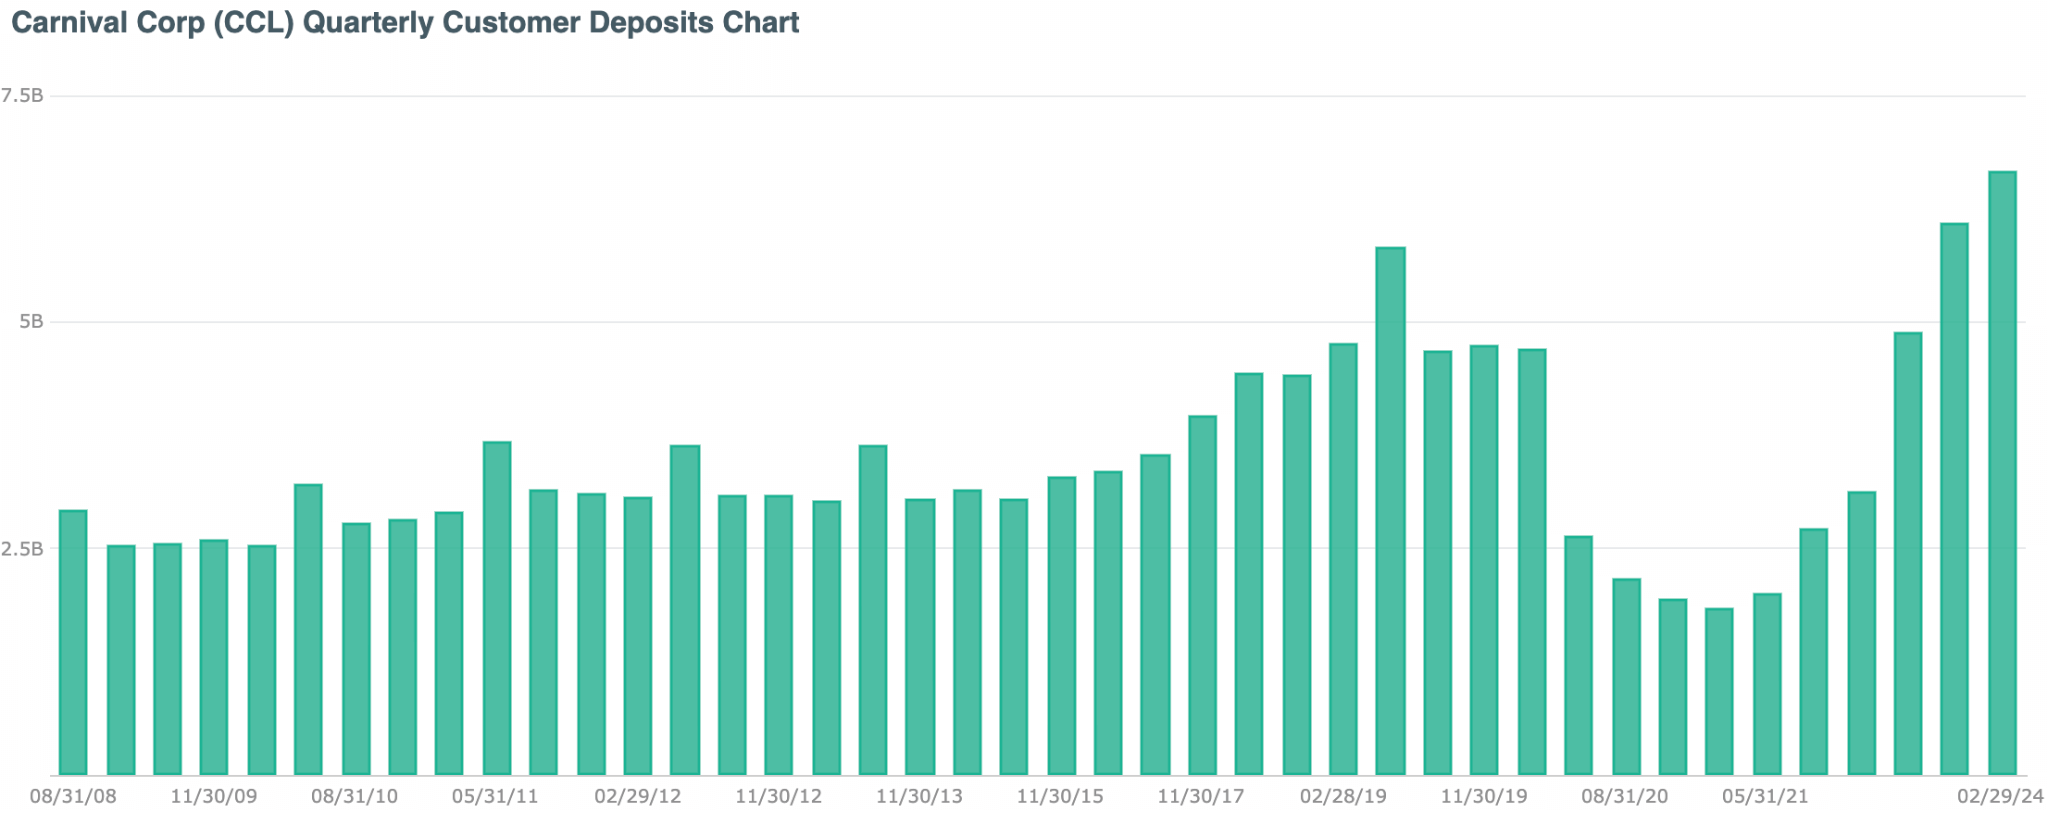
Source: discoverci
An indicator of significant insight is the increase in consumer deposits from $5.7 billion in Q1 2023 to $7 billion. These initial payments for future voyages, known as deposits, indicate the company's progress and prospective revenue. President and CEO of Carnival, Josh Weinstein, emphasized the following during the most recent earnings call:
Trends observed in early 2024 prompted management to increase full-year guidance. Carnival has revised its adjusted EBITDA forecast from $5.6 billion to approximately $5.63 billion.
Additionally, the firm updated its projected adjusted earnings per share for 2024 from $0.93 in December to approximately $0.98. Carnival is projected to achieve profitability for the first time since fiscal year 2019 in 2024.
Carnival Corp Business Merge
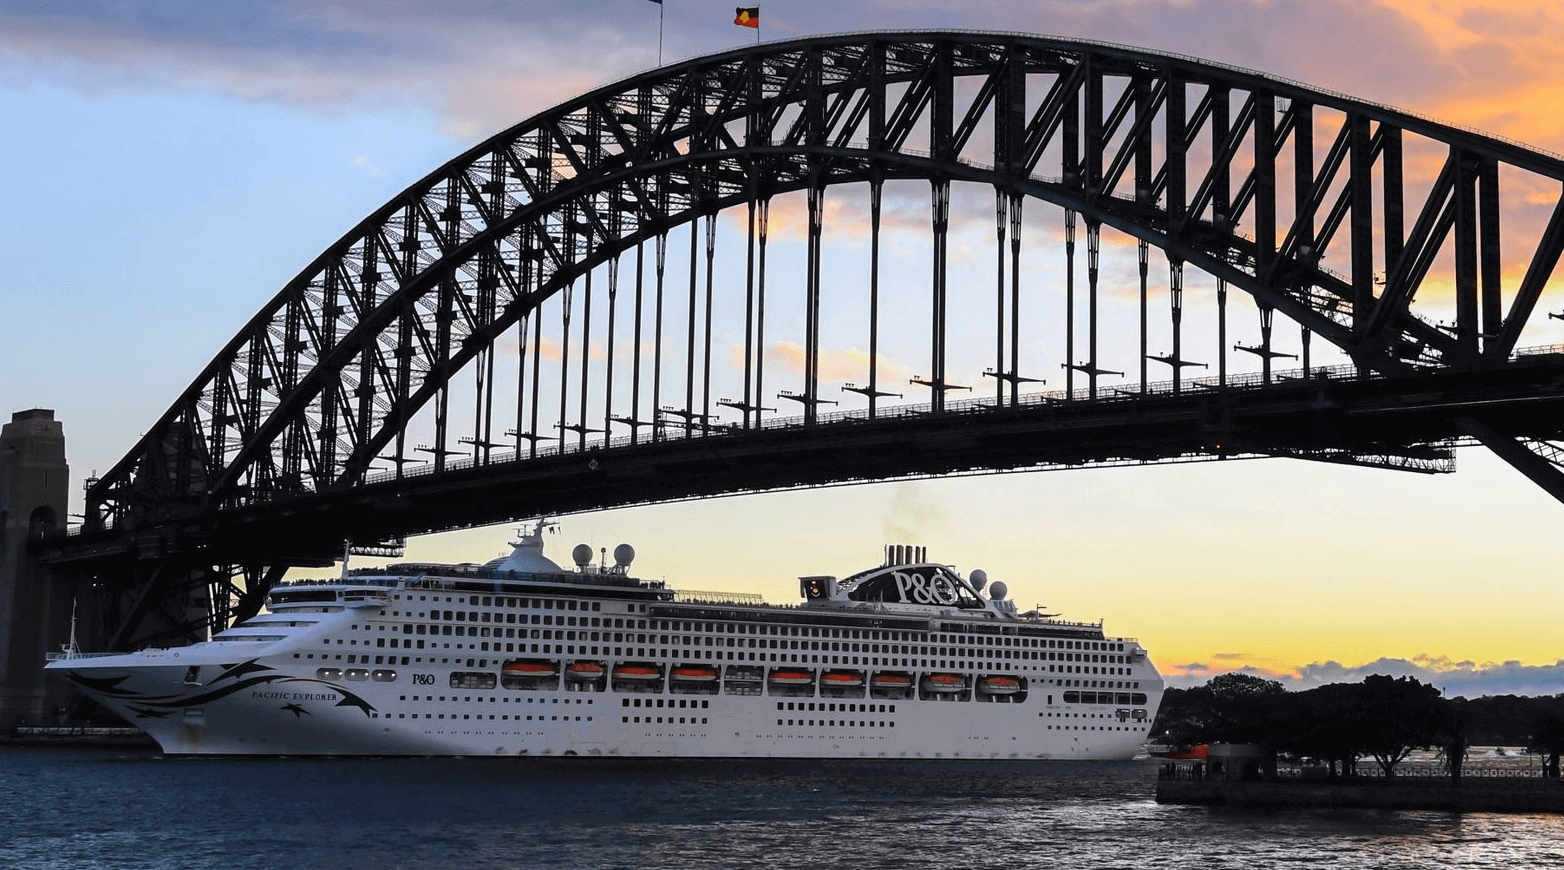
Carnival Corp. (CCL) intends to merge its P&O Cruises Australia brand with Carnival. This realignment aims to enhance operational efficiencies in the South Pacific. Carnival stock price has shown positive movement with the news, adding to the recent upbeat earnings reports. Therefore, investors might consider it a positive factor for the stock, but more clues are needed before anticipating the price movement.
Christine Duffy, president of Carnival Cruise Line, expressed her enthusiasm for the opportunity to introduce some of our innovations to more cruise passengers in the region, thereby honoring the history and heritage of P&O Cruises Australia.
"In the coming months, we will explore ways to celebrate and honor P&O Cruises Australia, which has been a valued part of our legacy and a significant contributor to the South Pacific tourism industry," Weinstein indicated. "We appreciate the connection our P&O Cruises Australia guests, employees, travel advisor partners, public officials, and destinations have with our company and are committed to strengthening this relationship as we move forward as Carnival."
Expert Insights on CCL Stock Forecast for 2024, 2025, 2030 and Beyond
Carnival stock (CCL) remains sideways at the bottom, suggesting a long opportunity from a discounted price. However, buying a stock needs proper validation from technical and fundamental perspectives.
Before proceeding to the in-depth CCL stock forecast for 2024, 2025, 2030, and Beyond, let's see what analysts think about Carnival stock:
|
Providers |
2024 |
2025 |
2030 & beyond |
|
Coinpriceforecast |
$18.57 |
$24.30 |
$49.00 |
|
Coincodex |
$14.90 |
$16.47 |
$ 18.99 |
|
Stockscan |
$8.84 |
$16.35 |
$56.48 |
II. CCL Stock Forecast 2024
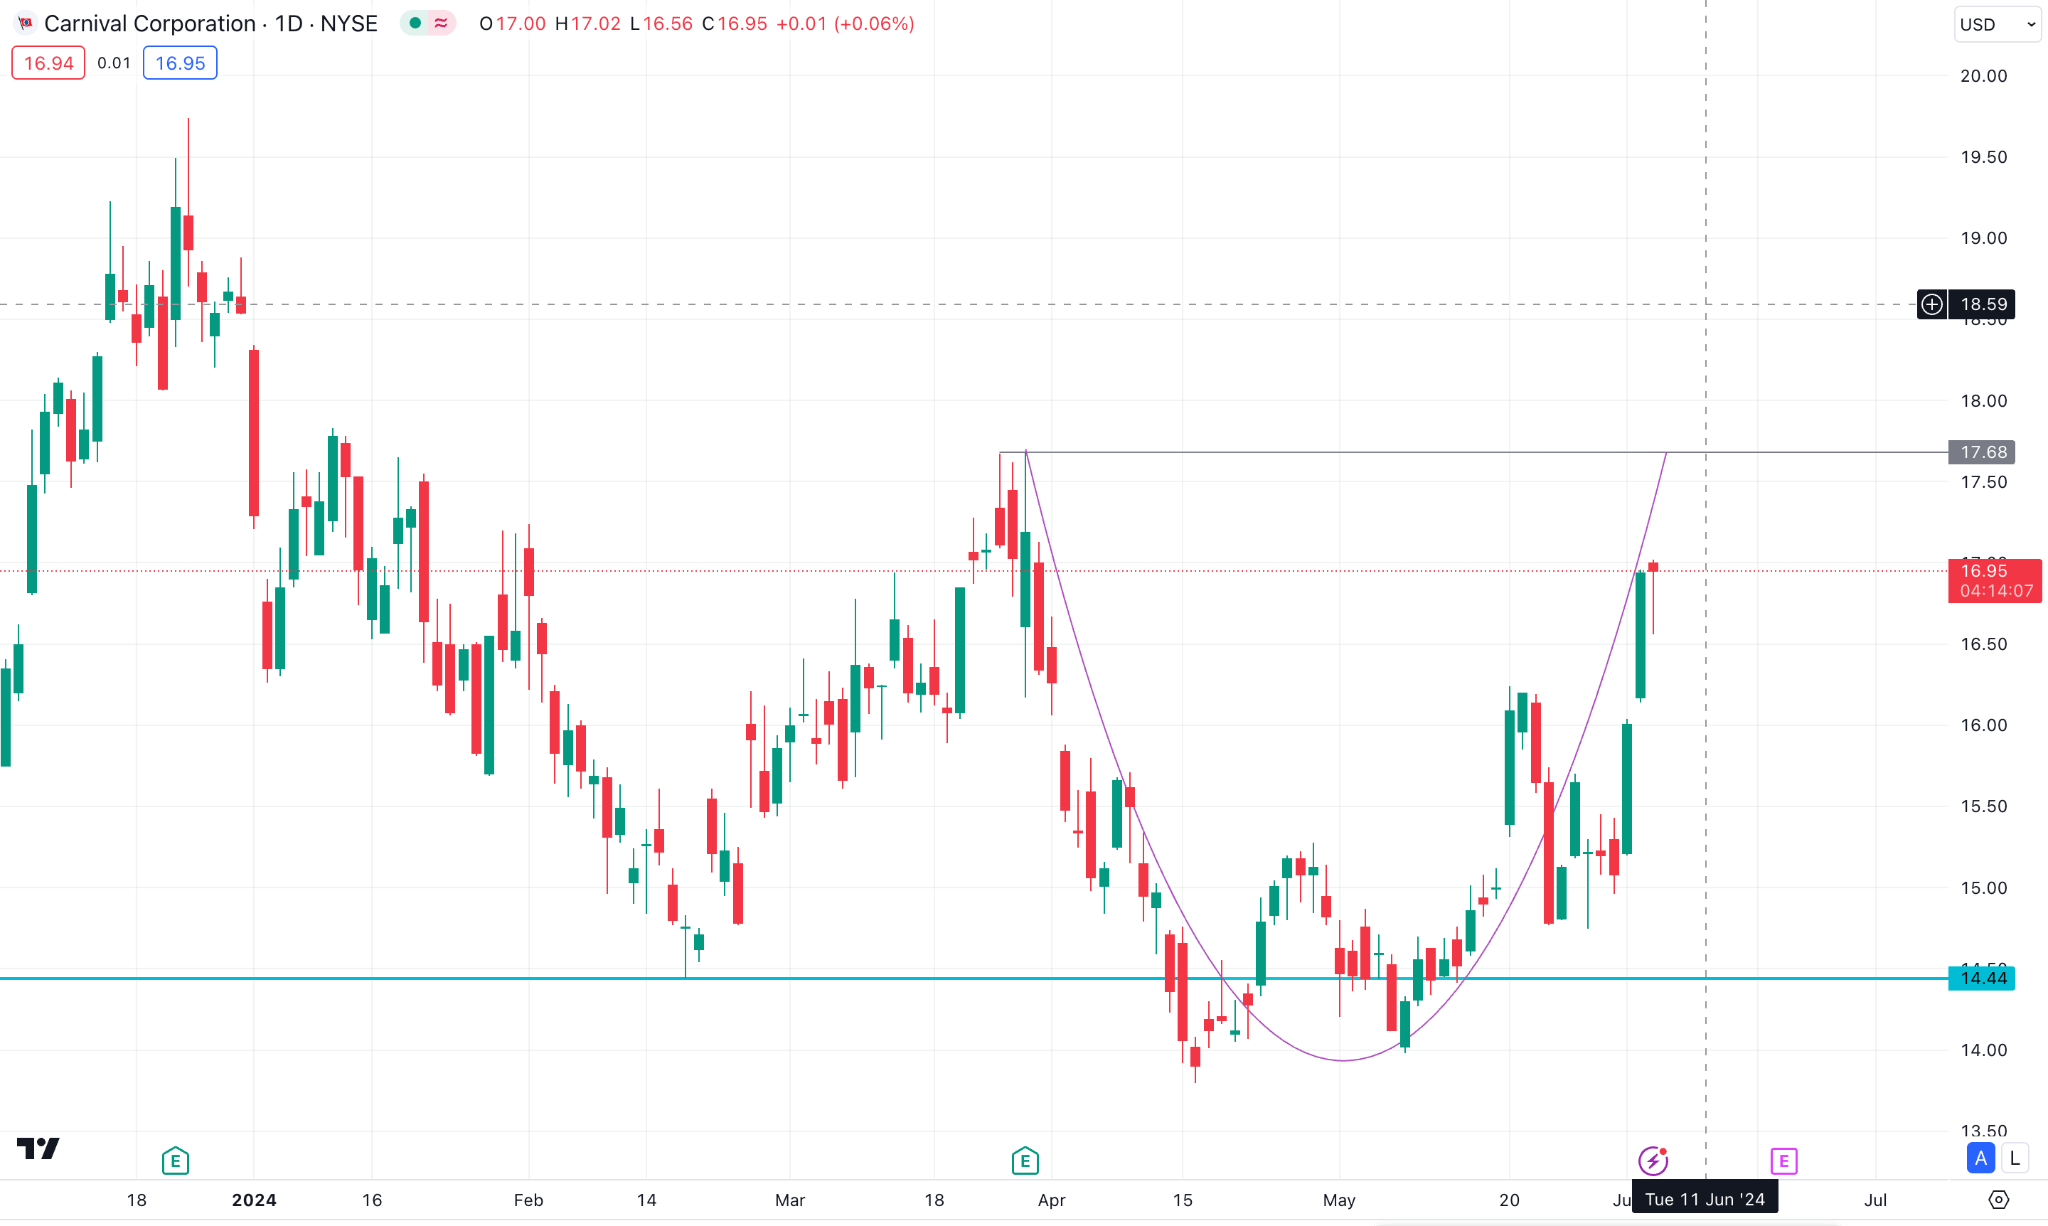
CCL has traded sideways in recent days, where a potential bullish breakout from the channel resistance could extend the upward pressure to the 19.75 level by the end of 2024.
In the daily chart of CCL, the most recent price shows a sideways momentum as the descending channel is active. A potential breakout would be the first sign of a trend reversal.
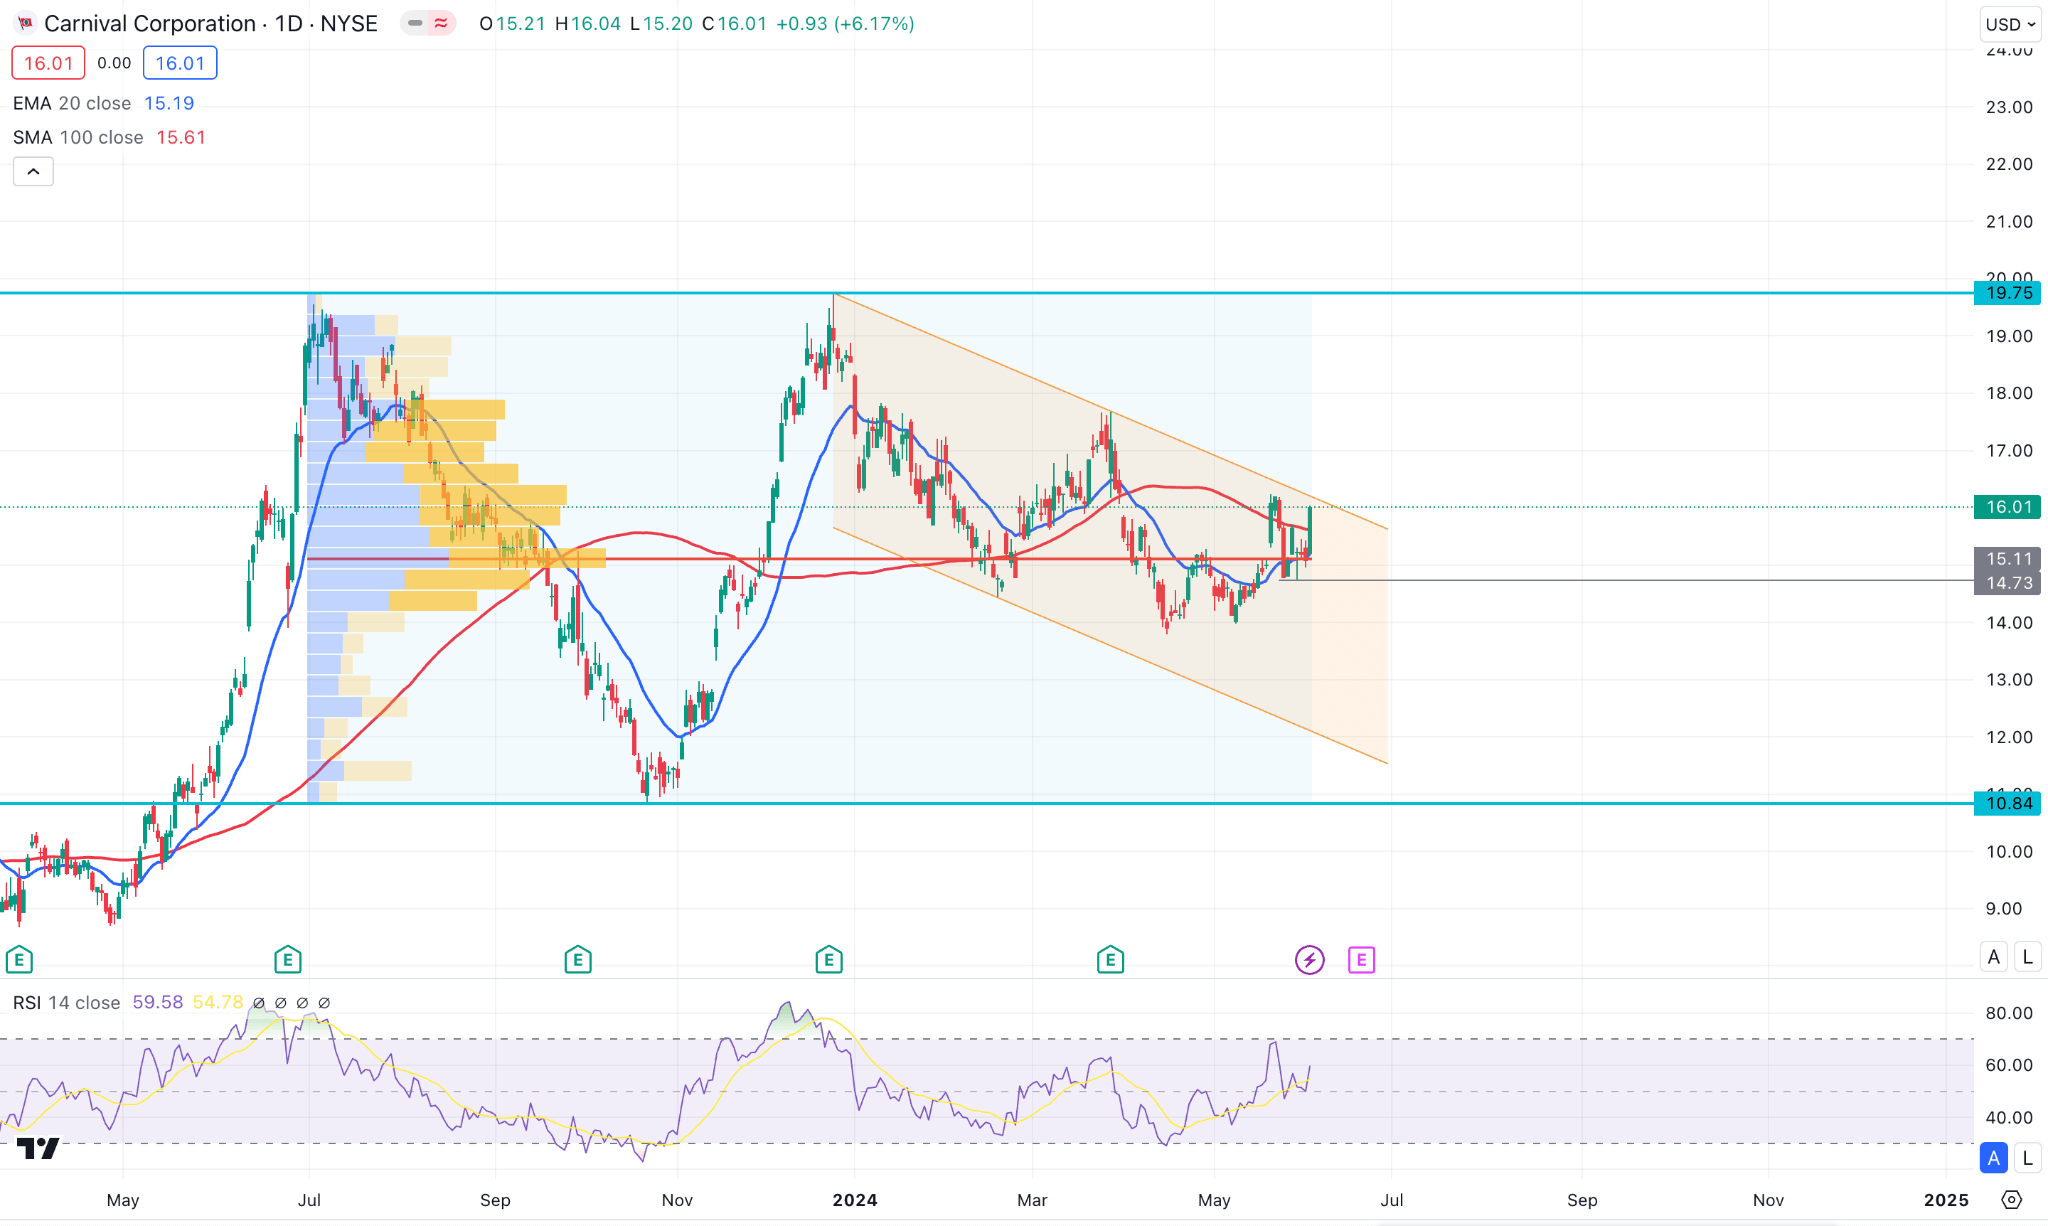
In the broader context, the prolonged buying pressure from the 10.84 low came with counter-impulsive bullish pressure but failed to break the 19.75 key resistance. Later, sideways momentum came below the 50% Fibonacci Retracement with an immediate bullish reversal. In that case, a potential bullish continuation could be a trend trading opportunity, targeting the existing near-term high.
In the main chart, the dynamic 100-day Simple Moving Average and 20-day Exponential Moving Averages are flat, suggesting a sideways momentum. Moreover, the 14-day Relative Strength Index (RSI) shows a buying pressure above the 50.00 line, which could extend above the 70.00 overbought area.
Based on the daily market outlook, the recent buying pressure is valid above the high volume line. Therefore, a valid daily candle above the 16.32 high could be a conservative, long approach that targets the 19.75 level.
However, a downside continuation below the 14.73 level could extend the loss towards the 10.44 support level.


