
The US Dollar Index is flat on the day after attempting to print a new multi-week high earlier in the session. The daily chart shows the DXY continuing to post higher lows and higher highs since the end of last year, and if this sequence continues then the double high made in mid-April and early May will be tested in the short-term.
US Dollar Index Daily Chart
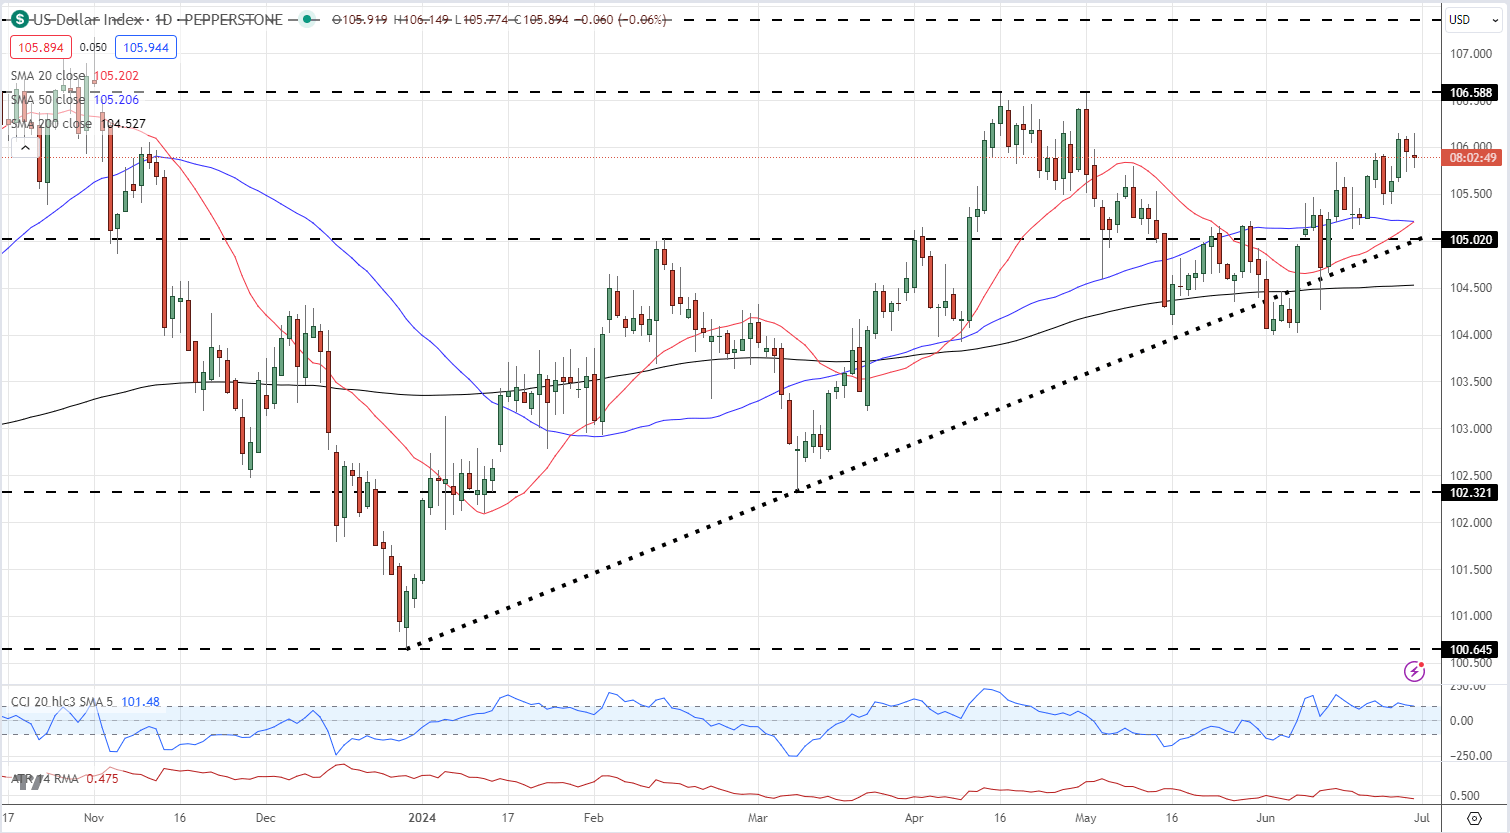
Chart using TradingView


