Netflix – Technical View
The Netflix share price, up over 45% year-to-date, is approaching its November 2021 record high at $700.99 which, since it was made near the major psychological $700 mark, probably won’t be easily overcome.
Netflix Monthly Chart
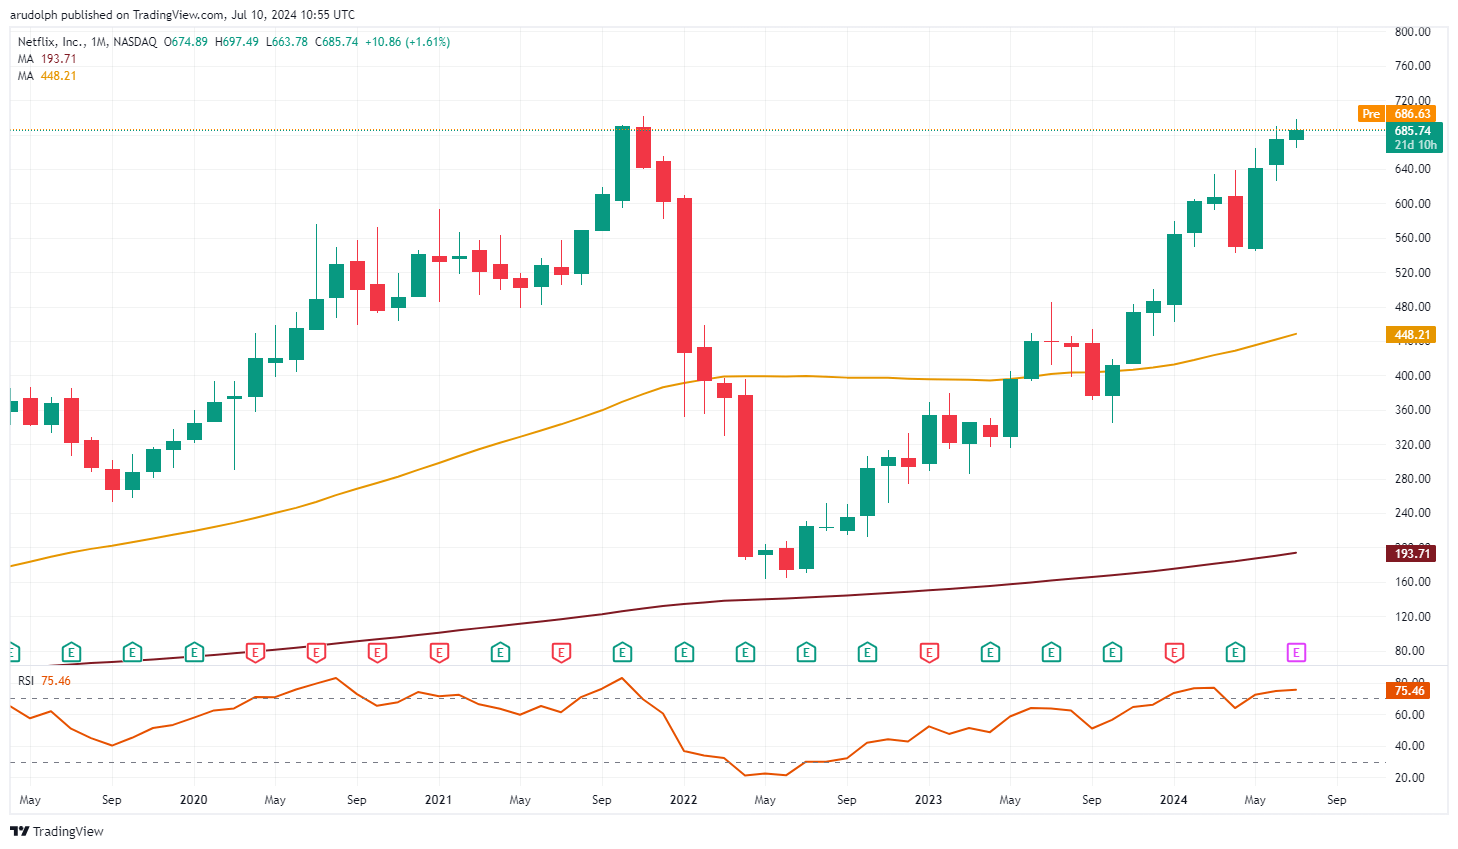
A rise above the $700.99 all-time high would allow for the $750 region to be in focus, though.
On the daily chart, the Netflix share price has been range bound since late June but last week did rise to its current July high at $697.49, close to the $700.99 record peak.
The upside is being supported by the May-to-July uptrend line at $678.42 below which good support can be spotted between the May high and the late June and early July lows at $633.78 to $662.30. While this area underpins, the short-term uptrend will remain valid.
Netflix Daily Chart
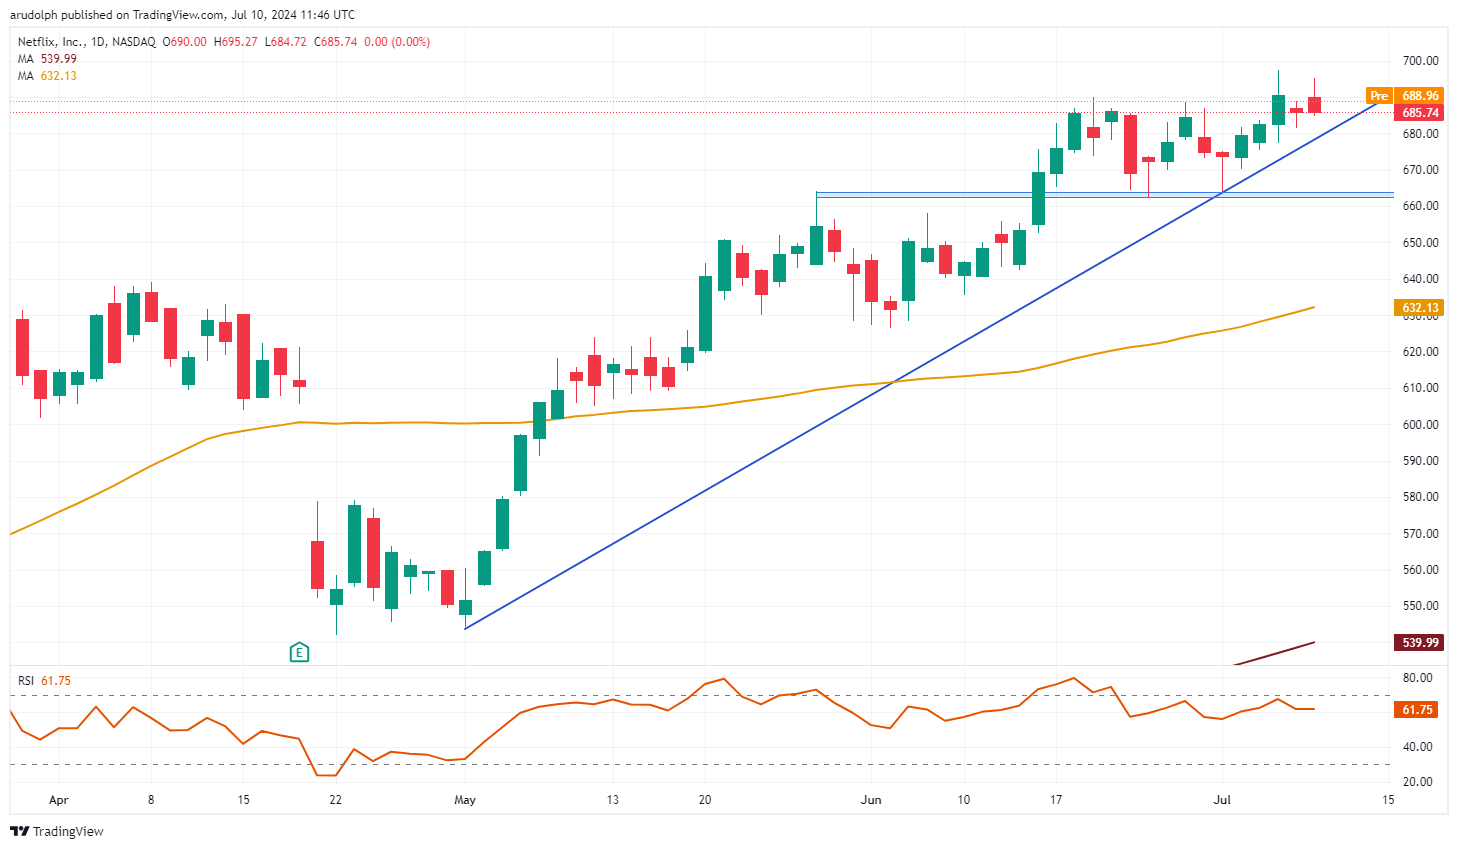
For a medium-term top to be formed, the Netflix share price would have to fall through its $626.44 June low. Slightly above this level the April high at $639.00 would be expected to offer support in such a scenario.


