

EURUSD
Fundamental Perspective
The EURUSD pair extended its decline for a second consecutive week, briefly reaching 1.0495 on Thursday, its lowest level in over a year. Although the pair managed a modest recovery by Friday, closing near 1.0520, the broader trend remained bearish. The U.S. dollar maintained its strength, buoyed by concerns over the global economic impact of evolving U.S. political dynamics. Despite this momentum, signs of overbought conditions emerged, limiting further appreciation.
Federal Reserve Chair Jerome Powell struck a cautious tone during a panel discussion, signaling that interest rate cuts would be gradual, given persistent inflation and the strong state of the economy. While not directly addressing political uncertainties, Powell alluded to potential challenges under the forthcoming Trump administration. His remarks tempered market expectations for aggressive rate reductions, with bets on a December cut retreating significantly. Robust US economic data, including an uptick in October's Consumer Price Index and better-than-expected Retail Sales, further bolstered the Dollar's position.
Meanwhile, the Euro struggled under the weight of weak economic performance. Germany's ZEW survey revealed deep pessimism, while Eurozone GDP growth for Q3 remained at 0.4%. Divisions within the European Central Bank over inflation risks added to the uncertainty, leaving markets to focus on critical economic releases and upcoming central bank commentary.
Technical Perspective
EURUSD posted another losing week, reaching a yearly low near 1.0500. This continued a bearish trend but left mixed signals as it approached a historic support level that sparked buyers' attention.
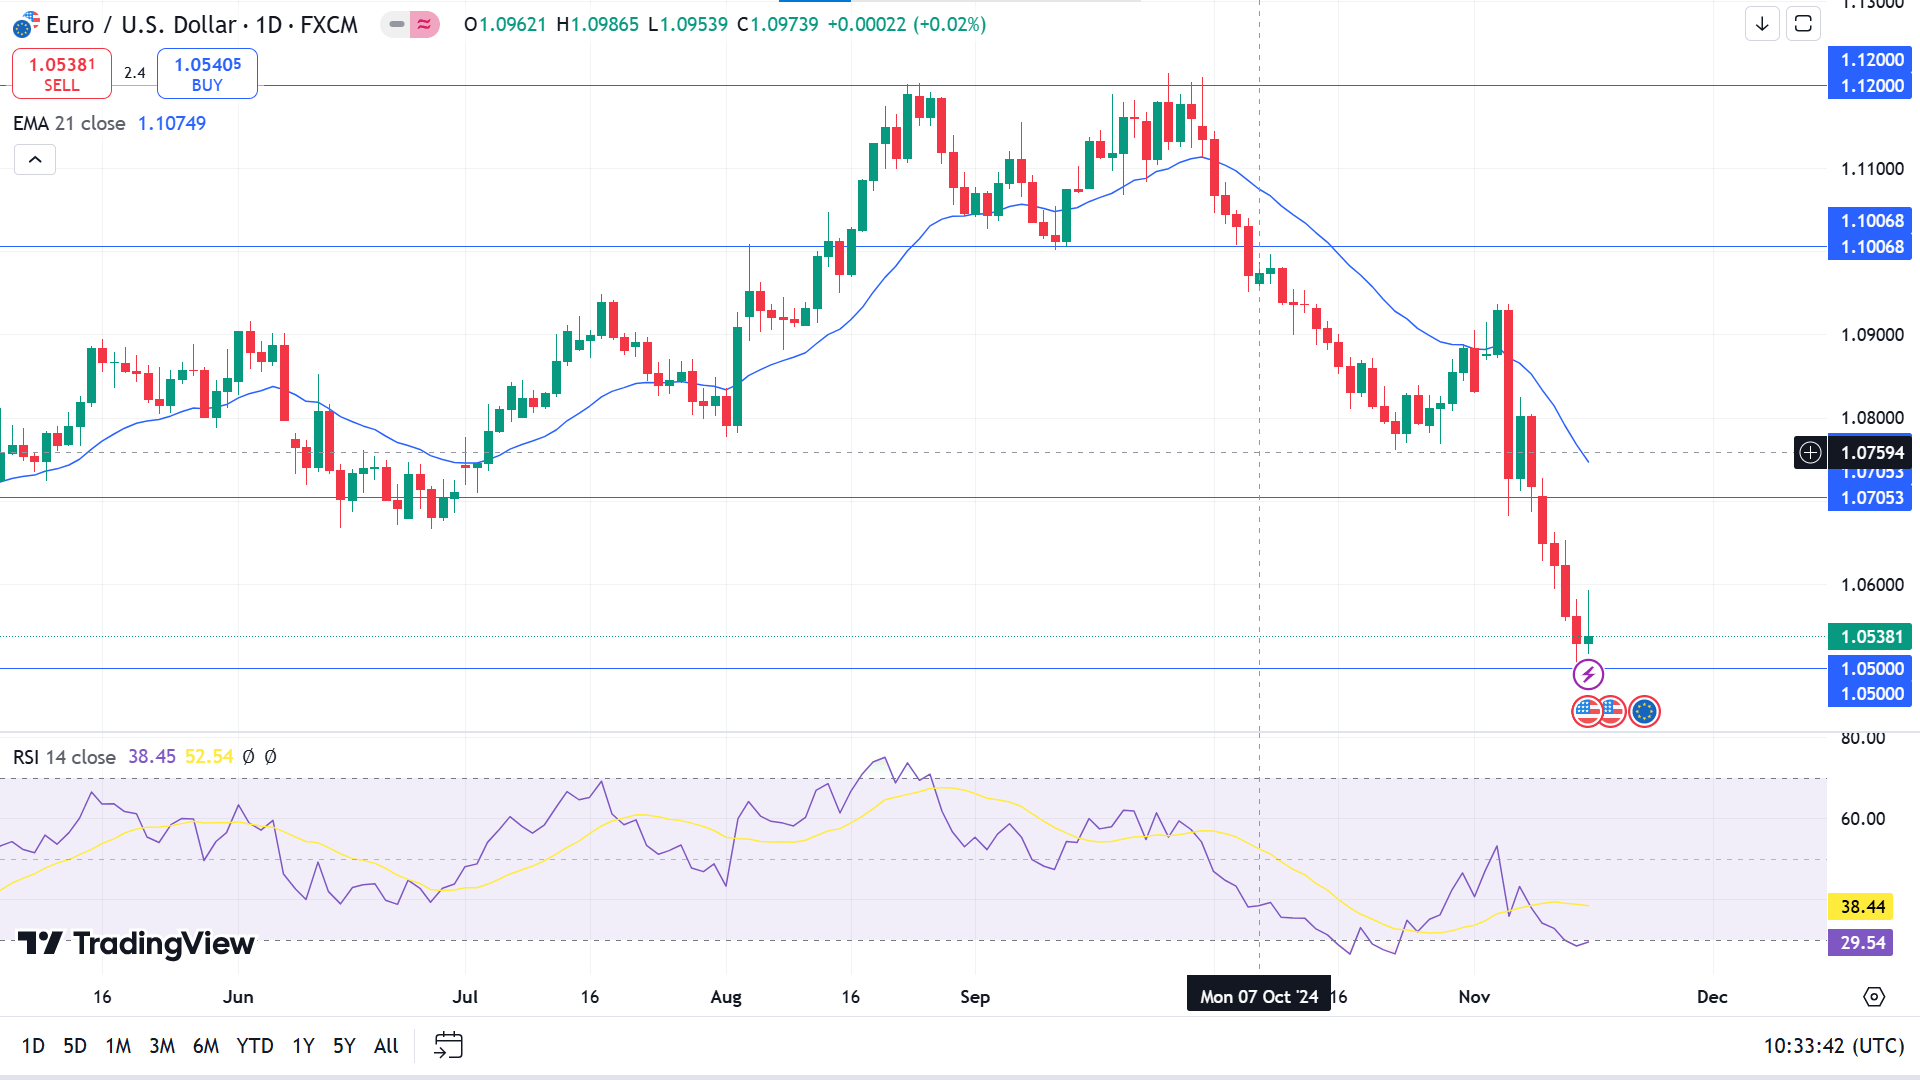
The daily chart reflects massive bearish pressure on the asset price, driving the price toward the year's low. EURUSD has been below the EMA 21 line for a long time, and the RSI dynamic line reaches the lower line of the indicator window due to recent sell pressure.
Applying the demand-supply concept to the asset, the area above 1.0500 seems an adequate buy zone. It can push the price back toward at least 1.0705, which is an acceptable resistance level that can extend further.
In contrast, if the price breaks below 1.0500 with a red candle and remains in that zone, the bullish signal won't be valid, and the sell signal may resume as it can continue to decline toward 1.0154 with consecutive selling pressure.


