
USD
On Wednesday, after the Federal Open Market Committee revised its interest rate forecasts to be more hawkish than expected, the U.S. dollar index rebounded from its lows. The Consumer Price Index (CPI) for May came in lower than expected, causing the index to drop to a low of 104.30. However, the dollar managed to recoup some of its losses, jumping to around 104.60. At the beginning of the week, the dollar index was on an upward trend, approaching the 105.50 area. The updated dot plot will provide valuable insights. Fed policymakers changed their stance from three rate cuts to two, which could raise the median for 2024 from 4.625% to 4.875%. The market expects the Fed to maintain a seemingly hawkish stance, keeping interest rates at 5.5%. Therefore, the likelihood of a rate cut in September seems to be 50:50, while the likelihood in November is about 85%. As market participants continue to assess the political tensions in Europe and the cautious stance ahead of the FOMC meeting, the dollar continued its strong start to the week, putting pressure on the risk complex on Tuesday.
From the daily chart, the dollar index not only managed to remain stable above the critical level of 105.00 but also returned to a strong position on the chart. The index is near the 20-day (104.63), 100-day (104.47), and 200-day (104.45) simple moving averages, reinforcing the bullish outlook. Additionally, the 14-day Relative Strength Index (RSI) has retraced below 50 (currently at 48.32), potentially supporting bullish sentiment. However, the Moving Average Convergence Divergence (MACD) indicates a weakened demand at current levels. On the upside, attention could be directed to 105.54 (61.8% Fibonacci retracement of the move from 106.50 to 103.99), a break of which points directly to 105.74 (the high of May 9), and 106.00 (psychological level). As for downside support, consider 104.58 (23.6% Fibonacci retracement) and 104.00 (whole number level).
Today, consider shorting the dollar index around 104.80, with a stop loss at 104.95 and targets at 104.45, 104.35.

WTI Spot Crude Oil
Due to weak Consumer Price Index (CPI) data, oil prices further increased. U.S. API inventory data showed a greater-than-expected reduction in stockpiles. The U.S. dollar index fell below 105.00, with potential to drop below 104. Despite the overall macroeconomic situation being less optimistic than in previous weeks, the anticipation of reduced global oil supply has continued to fuel a rebound in WTI crude oil prices. The market remains tight, keeping oil prices around $78.00 per barrel. While investor sentiment was low in the first half of the week, it remains elevated. Strong U.S. employment reports from last week reinforced the Federal Reserve's hawkish stance on monetary policy. The oil market has stabilized after the American Petroleum Institute (API) reported a greater-than-expected decrease in crude oil inventories this week, helping to offset the increase of 4.052 million barrels from the previous week.
From the daily chart, WTI crude oil has rebounded nearly 7.5% from recent lows near $72.60 per barrel, but the intraday bullish momentum has reached a key technical barrier at $78.50 per barrel. If the downward trend line remains intact, long-term bullish momentum could reach its limit in the short term. To reclaim the $80.00 mark, a breakthrough and hold near the 200-day moving average at $79.34 is needed. If oil prices turn to a downward trend, there could be a fall to $77.51 (50.0% Fibonacci retracement of the move from $67.94 to $87.08), followed by further levels at $76.79 (14-day moving average), and $75.25 (61.8% Fibonacci retracement of the move from $67.94 to $87.08).
Today, consider going long on crude oil around $78.08, with a stop loss at $77.80 and targets at $79.50 and $79.70.

XAUUSD
Following the Federal Reserve's decision to keep interest rates unchanged and during Chairman Powell's ongoing press conference, precious metals maintained a bullish tendency, staying above $2,300 per troy ounce. Earlier on Wednesday, gold prices defended the $2,300 mark while consolidating gains from the past two days. Ahead of the crucial U.S. Federal Reserve interest rate decision and U.S. inflation data release, gold traders opted for a cautious stance typical of market sentiment. Gold prices rose for the second consecutive day on Tuesday, building on a prior rebound even as the dollar regained upward momentum. The continued rise in gold prices can be attributed to a significant sell-off in U.S. Treasury yields amid strong U.S. Treasury auctions.
Observing the daily chart, gold prices entered a consolidation phase after a downward breakout near the key confluence support area around $2,350. At this level, the proximity of the 21-day simple moving average at $2,354 and the 50-day moving average at $2,345 is evident. Meanwhile, the 14-day Relative Strength Index (RSI) has turned downwards again, now below the 50 level, currently around 46, indicating that the risks for gold prices still lean towards the downside. The immediate short-term support for gold prices is at $2,300, with a break below this level threatening the May 3rd low of $2,277. A sustained break below the latter is crucial for a resumption of the downtrend. The next relevant support is at the psychological level of $2,250. Conversely, a rebound in gold prices would need to be recognized above the key confluence point (around $2,350), which has turned from support to resistance. At that point, gold buyers will aim for the May 24th high of $2,364 and the June 7th high of $2,388.
Today, consider going long on gold around $2,322, with a stop loss at $2,318.00 and targets at $2,338.00 and $2,340.00.

AUDUSD
On Wednesday, the AUD/USD pair saw a significant rise but was unable to sustain a breakthrough above the 0.6700 level prior to the release of key Australian labor market data and amid a weakening U.S. dollar. The ongoing strength of the dollar has been pressuring reserves, contributing to a selloff in forex markets. This sentiment partly lifted on Monday and broke through the 0.6600 area again on Tuesday amid bullish coal market trends. The rise in the dollar was crucially influenced by the increased market sentiment for crude oil following the elections in Europe last Sunday, renewed political concerns, and the pre-Federal Reserve decision control over oil prices. Additionally, the decline in copper and iron ore prices also contributed to the weakness. As the Federal Reserve is committed to tightening monetary policy, the Reserve Bank of Australia's potential limitations may maintain its nature in the short term, leading analysts to anticipate further consolidation for AUD/USD in the coming months.
From the daily chart, AUD/USD yesterday briefly rose above the 0.6700 level, and the possibility of a resumption of the upward trend may encourage a retest of the 0.6643 (21-day moving average), as well as the December 2023 high of 0.6871 and the July 2023 high of 0.6894 (July 14), ultimately aiming for the key level of 0.7000. The 14-day Relative Strength Index (RSI) rose to around 55.20, which is favorable for the currency pair in the short term. Occasional bearish attempts may push AUD/USD down to the psychological market level of 0.6000, and before reaching the critical psychological barrier of 0.6500, to 0.6542 (200-day moving average).
Today, consider going long on AUD/USD around 0.6650, with a stop loss at 0.6635 and targets at 0.6690 and 0.6710.

GBPUSD
With the dollar significantly weakened, the British Pound and other broadly risky assets maintained their buying preference unchanged. As Chairman Powell spoke about the outlook, GBP/USD remained near 1.2800. During Wednesday's London session, GBP/USD hovered around 1.2740, largely unaffected by the UK's April monthly Gross Domestic Product (GDP) and industrial production data. The Office for National Statistics (ONS) reported that, as economists had anticipated, the economy remained stagnant, indicating a weak start to the second quarter. The UK economy failed to grow in April, as mild expansion in the services sector was offset by declines in industrial production and construction output. The data indicated that a reduction in manufacturing activity was due to decreases in the pharmaceutical and food industries. Weak factory data suggest that households and businesses are struggling to cope with the high interest rates set by the Bank of England, which might prompt an earlier easing of monetary policy by the central bank.
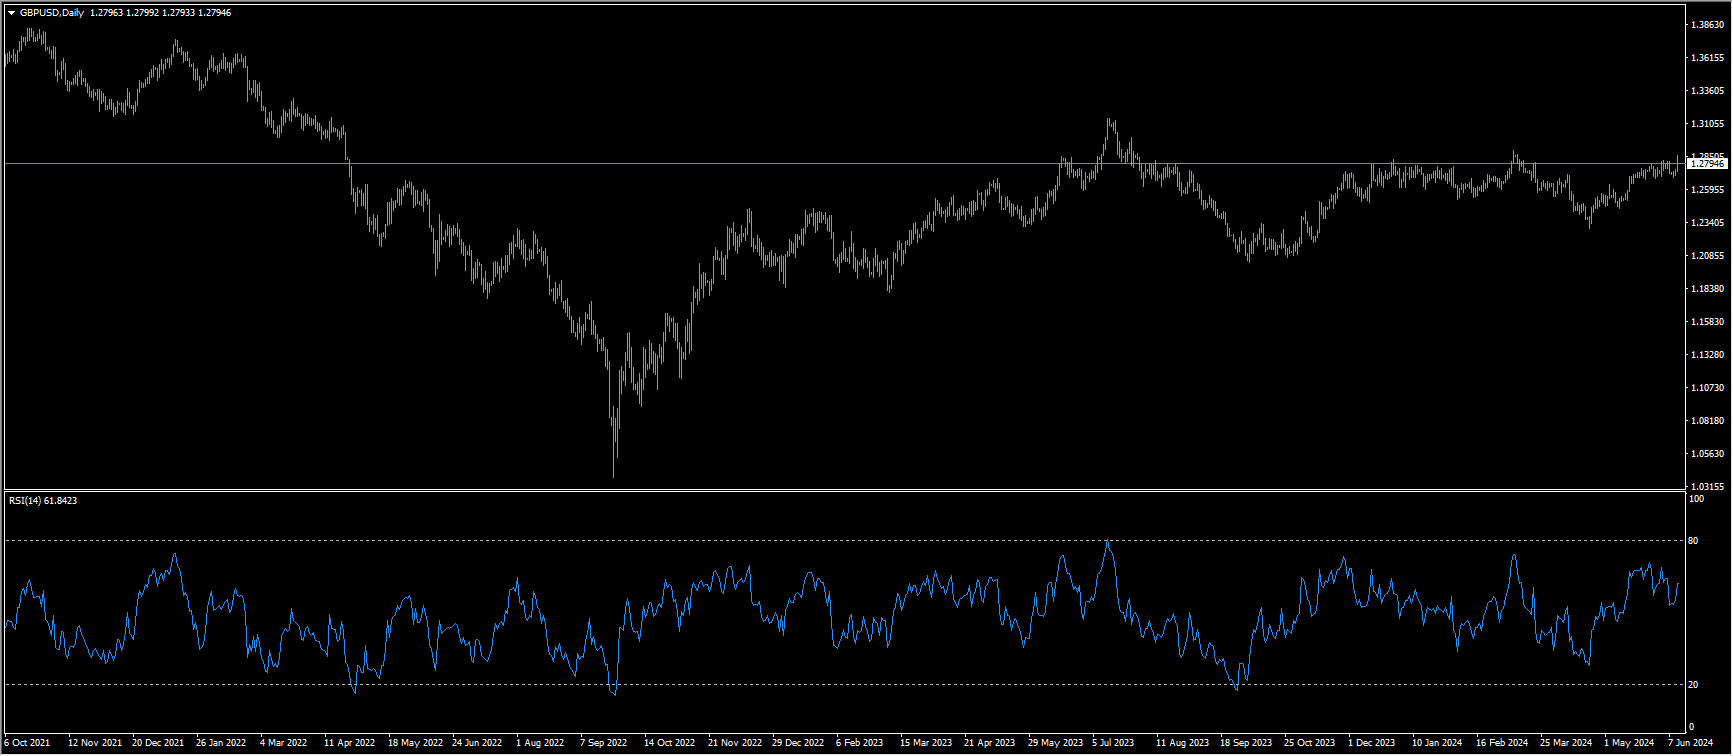
During Wednesday's Asian session, GBP/USD consolidated around 1.2740. On the daily chart, the pair remains within an ascending channel pattern, and the 14-day Relative Strength Index (RSI) is above the 50 level at 61.30, indicating a bullish inclination. Additionally, the Moving Average Convergence Divergence (MACD) momentum indicator has reinforced the bullish trend. The MACD line is above the central line and diverging above the signal line, indicating further upward potential. On the resistance side, the psychological barrier of 1.2800 poses a significant hurdle, followed by the static level at 1.2850. A break above this level could propel GBP/USD towards testing the upper boundary of the ascending channel near 1.3000. On the downside, initial support is at the 30-day moving average of 1.2675, with further support near the May 17 low of 1.2645. If GBP/USD breaks below this level, it may encounter additional downward pressure, potentially testing the retracement support near 1.2600.
Today, consider going long on GBP/USD around 1.2785, with a stop loss at 1.2770, and targets at 1.2820 and 1.2830.
USDJPY
The Federal Reserve's decision to keep interest rates unchanged, with a slight hawkish tilt due to officials raising the federal funds rate projections, led to a pullback in USD/JPY on Wednesday. However, the U.S. inflation report coming in below expectations before Federal Reserve Chairman Powell's speech put pressure on the dollar. The major trading price was at 156.26. During Wednesday's early Asian session, USD/JPY strengthened to around 157.15. Traders were inclined to wait and see before key events occurred. Last week’s stronger-than-expected U.S. employment data fueled expectations that the Fed might maintain higher interest rates for an extended period, providing some support for the dollar. The Fed held steady at its June meeting on Wednesday. Regarding the Japanese yen, the Bank of Japan is expected to keep interest rates unchanged on Friday. Moreover, a Reuters poll showed that nearly two-thirds of economists expect the Bank of Japan to begin tapering its monthly bond purchases, currently around 6 trillion yen (approximately $38 billion). Meanwhile, the interest rate differential between the U.S. and Japan continues to weaken the yen against the dollar, boosting the USD/JPY currency pair.
Mid-week, USD/JPY traded around 157.00. The daily chart displayed a bullish inclination, as the currency pair consolidated within the upper boundary of a symmetrical triangle. Additionally, the 14-day Relative Strength Index (RSI) was above the 50 level, indicating a continuing upward momentum tendency. The psychological level of 158.00 is a significant threshold. Breaking this level could provide support, potentially guiding USD/JPY towards the high of April 26 at 158.44 and near the upper boundary around 158.60. Further resistance is at 160.20, which is the highest level in over thirty-four years. On the downside, the psychological market level of 156.00 is a major support. Breaking below this level could intensify the downward pressure on the USD/JPY exchange rate, possibly driving it towards 155.00 (whole number level) and near the retracement support area at 154.95 (38.2% Fibonacci retracement of the move from 146.47 to 160.20).
Today, consider shorting the dollar around 156.75, with a stop loss at 157.00 and targets at 156.00 and 155.80.
EURUSD
The revival of strong selling pressure on the dollar has propelled EUR/USD to a three-day high near 1.0850, although some of the upward momentum faded as the U.S. trading session closed. Mid-week, EUR/USD faced a three-day decline triggered by the EU Parliament elections, which dampened market sentiment. Election results showed strong support for center-right and far-right parties across Europe, while left-wing parties suffered significant losses due to EU citizens' dissatisfaction with the economic vulnerability and the current policy strategies of Europe's established ruling parties. The Federal Reserve is expected to hold rates steady this week, but markets are highly attentive to the latest dot plot. As expectations for rate hikes in 2024 continue to diminish, investors are increasingly worried, effectively discounting the prospect of rate cuts in 2024.
Technically, in just three days this week, EUR/USD fell from challenging the bullish side of a horizontal channel back to the lower support line of the channel at 1.0798, and near the technical level of 1.0790 (a trend line extending upwards from the April 16 low of 1.0601). It is also challenging the June low of 1.0732, then the psychological level of 1.0700. A break below these key support levels could continue testing downwards to 1.0668 (78.6% Fibonacci retracement of the move from 1.0601 to 1.0916). On the upside, if it can reclaim above the psychological barrier of 1.08 in the short term, the next targets would be 1.0841 (23.6% Fibonacci retracement), and 1.0864 (the midpoint of the horizontal channel on the daily chart).
Today, consider going long on EUR/USD around 1.0785, with a stop loss at 1.0770, and targets at 1.0835 and 1.0850.

Disclaimer: The information contained herein (1) is proprietary to BCR and/or its content providers; (2) may not be copied or distributed; (3) is not warranted to be accurate, complete or timely; and, (4) does not constitute advice or a recommendation by BCR or its content providers in respect of the investment in financial instruments. Neither BCR or its content providers are responsible for any damages or losses arising from any use of this information. Past performance is no guarantee of future results.


