
US Dollar Index
On Thursday, the Dollar Index surged significantly against the backdrop of rising U.S. Treasury yields. Market participants analyzed several recently released mid-term data points, including May's weak retail sales data, which declined midweek. On Thursday, the dollar shrugged off the impact of weak labor and housing data. U.S. May retail sales rose 0.1% month-on-month, while April's figure was revised down to a 0.2% decline, below the consensus growth of 0.3%. Core retail sales, excluding automobiles, gasoline, and building materials, increased by 0.4% month-on-month, slightly below the 0.5% consensus. The week's focus is on Friday's preliminary Purchasing Managers' Index. Weaker data is expected to weigh on the dollar's performance. In a speech at the Federal Reserve, Mussa acknowledged that recent actual consumer spending and nominal retail sales data have mostly been disappointing. He also stated that before being confident that a rate cut is appropriate, he needs to observe a period of favorable inflation, slowing demand, and expanding supply. Additionally, Collins mentioned that the Federal Reserve should remain patient when considering the timing of rate cuts. The Dollar Index remained narrowly oscillated above 105.00.
The mild bullish momentum on the daily chart remains intact, with the 14-day RSI easing from around 54.00. Support is seen at 104.92 (38.2% Fibonacci retracement level from 102.35 to 106.51). A break below would point to 104.47 (200-day moving average) and 104.43 (50.0% Fibonacci retracement level) support areas. Resistance is at 105.80 (last Friday's high) and 106.00 (psychological threshold). In the absence of key catalysts, it may trade narrowly between 105.20 - 105.80.
Today, consider shorting the Dollar Index near 105.78, with a stop loss at 105.90 and targets at 105.45 and 105.40.

WTI Spot Crude Oil:
On Thursday, oil prices continued to oscillate around $81.50, marking another profitable performance for the week. Traders maintained price support amid escalating tensions in the Middle East. As safe-haven flows increased, the Dollar Index returned to near 105.50. In a thin market, WTI crude tested Wednesday’s new high, breaking through $81.00, boosted by the Juneteenth holiday closure of the U.S. market, while commodities remained steadily higher. WTI crude reached a seven-week high and is poised for a second consecutive weekly gain as it recovers from recent dips. However, if U.S. crude production continues to outpace demand, the energy market’s expectations for increased summer energy demand may falter. OPEC+ is set to end voluntary production cuts later this year. Nevertheless, barrel traders are hopeful that the uncertain prospect of rising summer energy demand will curb the current supply surplus.
From a technical perspective, WTI U.S. crude temporarily halted its technical rebound from the previous major low of $72.62 (June 4). In the past 11 consecutive trading days, except for four sessions, WTI prices have closed higher, successfully breaking above the 200-day moving average at $79.14 and the psychological threshold of $80.00. A weakening bullish momentum could push U.S. crude prices back below the 200-day exponential moving average, driving WTI lower and potentially breaking below the 2024 high of $87.00, and falling through the upper channel line at $77.20. On the upside, watch for the $82.56 level (23.6% Fibonacci retracement from $67.94 to $87.08) and the $84.15 area (April 26 high).
Today, consider going long on crude oil near $81.30, with a stop loss at $81.00 and targets at $82.55 and $82.70.

Spot Gold
Gold extended its daily gains on Thursday, reaching a two-week high at $2,365.50. Despite rising U.S. bond yields and a mildly stronger dollar, gold benefited from escalating geopolitical tensions and maintained its bullish momentum. Over the past few days, gold has shown little vigor, but it is worth noting that prices are at record levels. Gold hit an all-time high of $2,450 in mid-May. The previous record was $2,070.50, set two years ago, which is significantly lower than the current comfortable zone above $2,300. Since the highest point in March 2022, gold prices have successfully risen by about 20%. It is noteworthy that in early 2020, during the height of the global pandemic, gold was trading around $1,550. This is not only related to the pandemic. Economic recession, inflation, and war are also major concerns for investors. Clearly, market sentiment has dominated the financial markets and will continue to do so for some time. In fact, the market seems poised for a corrective decline, but it is more likely that speculative interest will increase on dips. Regardless, in the near term, gold prices showed no life on Wednesday, coinciding with the U.S. holiday. The U.S. celebrated Juneteenth, with local markets closed for a day. Nevertheless, there were no macroeconomic data releases or speeches from Fed officials to act as intraday catalysts for the dollar.
From a technical perspective, the daily chart shows that the moderately bearish 50-day simple moving average at $2,343.80 and $2,350.00 per ounce forms dynamic resistance, encountering obstacles for the fourth consecutive day. At the same time, the 14-day Relative Strength Index (RSI) has remained around 54.00 this week, reflecting a slight advantage for the bulls and increasing buying interest. Finally, the 75-day ($2,305) and 89-day ($2,265) simple moving averages are firmly downward, far below the current price, indicating that any upcoming fluctuations may only be technical corrections. The next resistance levels to watch are the May 29 cycle high at $2,361.40 and the June 7 high at $2,387.
Today, consider going long on gold before $2,355.00, with a stop loss at $2,352.00 and targets at $2,375.00 and $2,380.00.

AUDUSD
The AUD/USD pair has retraced its gains from the past few trading days, returning to the 0.6650 area amid weak risk sentiment and a significant rebound in the dollar. The Reserve Bank of Australia's hawkish stance at its June meeting on Tuesday continues to support AUD/USD. On Thursday, the Aussie marked its third consecutive day of gains. Additionally, weaker-than-expected retail sales have fueled market speculation that the Federal Reserve may cut rates later this year, weighing on the dollar and boosting AUD/USD. However, the RBA stated that the economic outlook remains uncertain, and the process of bringing inflation within target is unlikely to be smooth. Traders will seek more clues from Friday's preliminary PMI data from Australia's Judo Bank. Signs of economic weakness in Australia could prompt the RBA to lower borrowing costs, putting downward pressure on the Aussie.
The Aussie strengthened on Thursday. Since May 8, AUD/USD has formed a symmetrical triangle pattern. The daily chart shows AUD/USD above the critical 100-day exponential moving average at 0.6639 and 0.6620 (the midpoint of the horizontal channel), maintaining a bullish bias. The 14-day Relative Strength Index (RSI) remains bullish, reinforcing the upward trend in AUD/USD. A clear breakout above the symmetrical triangle's upper boundary at 0.6670 would attract buyers towards the psychological level of 0.6700. If AUD/USD continues to rise, it could reach the January 4 high of 0.6760. On the downside, the 0.6590-0.6600 area is key support for AUD/USD. This level coincides with the 50-day exponential moving average and the lower boundary of the triangle pattern. A break below this level would test the 200-day moving average at 0.6548.
Today, consider going long on AUD before 0.6640, with a stop loss at 0.6620 and targets at 0.6680 and 0.6695.

GBPUSD
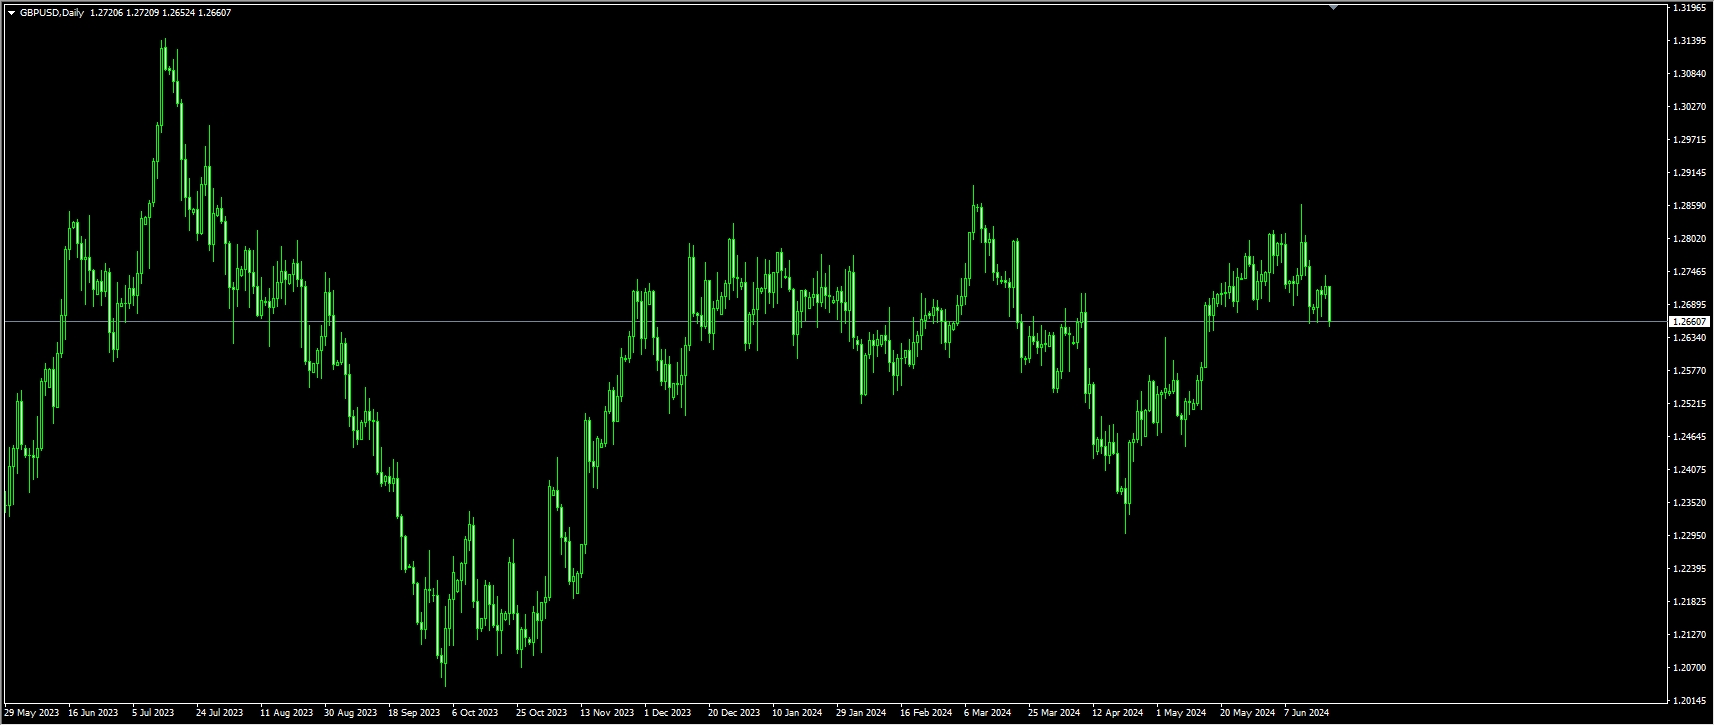
GBP/USD remains at a disadvantage at 1.2654 due to the renewed strength of the dollar, while the Bank of England's dovish stance earlier in the session also aligns with the new downward trend on Thursday. GBP/USD had firmly broken above 1.2700 in calm trading on Wednesday, as traders took a wait-and-see approach ahead of the BoE meeting. With U.S. markets closed midweek for Juneteenth, trading was subdued, keeping overall volume low and allowing the dollar’s counterparts to make slight gains. The latest UK services inflation data slightly disappointed the BoE, coming in 0.4 percentage points higher than forecasted in May’s monetary policy report. Factors like rent growth remain quite strong, though consistent with previous months. However, the market doubts the BoE will be able to cut rates in August.
After hitting a three-month high of 1.2860 last week, GBP/USD has dropped over 100 points to 1.2654, clearing the support trendline from the May 17 low, passing near 1.2730. Despite the 14-day Relative Strength Index (RSI) being just above the neutral line at 50, momentum favors buyers. However, the pair failed to maintain an upward trend above 1.2800. Key resistance lies at the 20-day moving average of 1.2743 and this week's high of 1.2740, followed by 1.2800. Once breached, the next target will be the monthly high of 1.2860. Conversely, if GBP/USD falls below 1.2700, it would expose technical supports such as 1.2645 (38.2% Fibonacci retracement from 1.2299 to 1.2860) and the converted support at the May 3 high of 1.2634, with the next level at 1.2600 (psychological threshold).
Today, consider going long on GBP before 1.2640, with a stop loss at 1.2620 and targets at 1.2700 and 1.2710.
USDJPY
USD/JPY is in a long, medium, and short-term uptrend, approaching the "intervention zone" where Japanese authorities previously intervened. Therefore, the risk of further intervention and adjustment is increasing. On Thursday during the U.S. session, USD/JPY consolidated slightly below the 159.00 level, at 158.90, remaining near the highest level since late April reached last week. Given the mixed fundamental backdrop, caution is warranted before setting up positions to extend the upward trend of the past two weeks. The yen has been influenced by the Bank of Japan's decision to hold off on discussing reductions in Japanese government bonds until the next meeting. Additionally, the generally bullish tone in global equities has diminished the yen's safe-haven appeal, supporting the USD/JPY pair.
However, speculation about potential intervention by Japanese authorities to support the yen, along with ongoing geopolitical tensions in Europe and uncertain political outlooks, should limit the yen's downside. Furthermore, BOJ Governor Kazuo Ueda's recent hawkish comments, suggesting a possible rate hike in July based on economic data, may curb aggressive yen shorts. Meanwhile, the dollar has struggled to attract key buyers, hovering near a weekly low, supported by expectations of two rate cuts by the Fed this year and signs of cooling inflation, which might constrain the USD/JPY rate.
Technically, the uptrend in USD/JPY remains intact, with the pair staying above the 157.00 level (the midpoint of the horizontal channel on the daily chart) and 156.94 (20-day moving average). This supports further upside for USD/JPY, but concerns about potential market intervention by Japanese authorities keep traders cautious. The 14-day Relative Strength Index (RSI) is at 65.96, indicating a bullish trend that supports buyers. The first key resistance is yesterday's high at 158.94. Once breached, the next target is 159.00 (upper boundary of the horizontal channel on the daily chart), followed by 160.20.Conversely, if USD/JPY breaks below 157.00, sellers might challenge key support levels. The first is the June 14 high at 158.25, followed by 156.10 (an upward trendline from the March 11 low of 146.48).
Today, consider shorting USD before 159.20, with a stop loss at 159.50 and targets at 158.30 and 158.10.

EURUSD
Due to the noticeable rebound in the dollar and widespread risk-off sentiment, EUR/USD faces renewed downward pressure and is retesting the 1.0700 area. On Wednesday, the Dollar Index hovered near the 105.00 low, providing slight support for risk sentiment and allowing EUR/USD to extend its upward momentum for the third consecutive day, trading near 1.0700. The easing of French political concerns also supported a slight rise in EUR/USD, along with speculation that the Federal Reserve may cut rates later this year.
On the Fed front, the recent cautious stance of Fed officials, who reiterated their prudent approach to initiating an easing cycle, seems to limit the dollar's downside. In the short term, the contrast between the European Central Bank's recent rate cut and the Fed's decision to maintain rates highlights the policy gap between the two central banks, potentially leading to further weakness in EUR/USD. Looking ahead, signs of economic recovery in the Eurozone and a noticeable slowdown in the U.S. economy could alleviate the differences in ECB and Fed rate policy outlooks, providing some support for EUR/USD in the near term.
The daily chart shows that if the EUR/USD rebound momentum continues to strengthen, the 200-day moving average at 1.0788 will be a near-term target, followed by 1.0800 (psychological level) and the weekly high of 1.0852 (June 12 area). If EUR/USD breaks above this level, it will face the critical point at 1.0900 (round number). The 14-day Relative Strength Index (RSI) is at 39.82, indicating momentum favors the bears. If the bears regain control, the pair may retest the 1.0700 (psychological level) and the June low of 1.0667 (June 14), then the 2024 low of 1.0601 (April 16) and 1.0600 (psychological level).
Today, consider going long on EUR before 1.0685, with a stop loss at 1.0670 and targets at 1.0740 and 1.0750.

Disclaimer: The information contained herein (1) is proprietary to BCR and/or its content providers; (2) may not be copied or distributed; (3) is not warranted to be accurate, complete or timely; and, (4) does not constitute advice or a recommendation by BCR or its content providers in respect of the investment in financial instruments. Neither BCR or its content providers are responsible for any damages or losses arising from any use of this information. Past performance is no guarantee of future results.


