
DXY
Last week, the U.S. Dollar Index, which measures the dollar's value against a basket of major currencies, weakened after the release of significant U.S. Personal Consumption Expenditures (PCE) data for August. Headline PCE inflation, the Federal Reserve's preferred inflation gauge, came in lower than expected, while core PCE inflation was in line with expectations. Investors will closely monitor upcoming data and continue to bet on the Fed's next decision. The focus has now shifted to labor market data for September. Expectations of future Fed rate cuts continue to broadly weaken the dollar. The Fed decided to cut interest rates by 50 basis points. Fed Chair Jerome Powell indicated that the 50 basis point rate cut was a "recalibration" of rates, which may drag the dollar index lower in the short term. According to the CME Group's FedWatch tool, the market currently sees a nearly 48.8% chance of another significant 50 basis point rate cut by the Fed, while the likelihood of a 25 basis point cut stands at 51.2%. Fed Governor Kugler maintained the Fed's dovish tone, saying, "I strongly support the Federal Open Market Committee's decision last week to lower the federal funds rate by 50 basis points, and if conditions continue to evolve as they have so far, further rate cuts will be appropriate." Thus, with the Fed signaling an early rate cut, investors should also be cautious of end-of-quarter fund flows, which may distort price movements in the short term.
Technical analysis from the weekly chart shows that the Dollar Index remains vulnerable to further declines, as the 14-week Relative Strength Index (RSI) and the Moving Average Convergence Divergence (MACD) continue to trend downward and struggle to gain momentum. The levels of 100.93 (14-day moving average) and 101.00 (round number resistance) remain strong resistance, limiting the dollar’s upward potential. If the Dollar Index reverses and breaks through the key resistance area of 100.93 - 101.00, it is possible that the index could rise back to 101.60 (a downtrend extending from the June 28 high of 106.13) and 101.63 (the 9-week moving average). A break through this level would test the 102.33 region (the 61.8% Fibonacci retracement from 94.63 to 114.78). On the downside, the 100.20 and 100.16 recent bottom areas form a key "double bottom" support zone, especially if there is further weakness this week. The psychological level of 100.00 will be the next important level to watch. If this level is breached by the bears, it could point to the July 14, 2023 low of 99.58, and the 99.68 region (61.8% Fibonacci retracement from 90.35 to 114.78).
Today, consider shorting the Dollar Index around 100.55, with a stop loss at 100.65 and targets at 100.20 and 100.10.

AUD/USD
Last week, AUD/USD surged to a high of 0.6937, its highest level since February 2023. Optimism surrounding China's stimulus measures, including the People's Bank of China's monetary easing policies, provided support to the Australian dollar and boosted investor risk appetite. The weak U.S. Personal Consumption Expenditures (PCE) data for August also contributed to a weaker U.S. dollar. On one hand, the Reserve Bank of Australia (RBA) is not planning to cut rates, while the Federal Reserve has already started its easing cycle, adding downward pressure to the currency pair. Starting mid-week, AUD/USD and other risk assets regained momentum, reversing Wednesday's sharp decline and reclaiming the 0.6900 level, hovering around the annual highs once again. The strong rebound in AUD/USD was in response to news of China's Politburo promising to increase welfare for the poorest population and provide necessary funds to local governments to prevent further declines in housing prices. Prior to this, the People's Bank of China had introduced a series of stimulus measures aimed at revitalizing the property sector and boosting the stock market, with a focus on stabilizing the real estate market and improving consumer spending mechanisms. Additionally, the RBA could be one of the last G10 central banks to begin cutting rates. Given weak economic activity and declining inflationary pressures, it is expected that the RBA will join the global easing cycle later this year.
Last week, AUD/USD finally broke through the range highs and continued its upward trajectory. In line with the "trend is your friend" principle, AUD/USD is in a short-term uptrend and is likely to extend its gains. The 14-week Relative Strength Index (RSI) is currently at 62.70, indicating ample room for further upside, with the upward tilt becoming more pronounced, reflecting the strengthening rebound of the Australian dollar. If it manages to break through last week's high of 0.6937, the initial upward target will be the 200-week simple moving average at 0.6963, with a further test of the psychological level at 0.70. In a bullish scenario, the next resistance would be 0.7156 (the high from February 2, 2023). On the downside, before reaching 0.6739 (the 38.2% Fibonacci retracement from 0.7661 to 0.6170), AUD/USD may first dip to the 9-day simple moving average at 0.6832, with further downside potentially extending to the 0.6700 (round number support) level.
Today, consider going long on AUD around 0.6890, with a stop loss at 0.6875, and targets at 0.6935 and 0.6945.

EUR/USD
Last week, EUR/USD traded rather uneventfully around the 1.1200 level, although it continued its efforts to break through this key level. Midweek, the pair managed to refresh its 2024 high at 1.1213, but sellers near that area once again rejected the euro. Concerns about the lack of progress in the European economy, coupled with speculation that the U.S. Federal Reserve may continue to cut interest rates aggressively, kept investors cautious. Throughout most of the week, EUR/USD struggled to find direction, as European macroeconomic data remained lukewarm, limiting the euro's gains despite a generally weaker U.S. dollar. Early this week, the focus will shift to Europe, as Germany and the Eurozone are set to release their preliminary estimates of the Harmonized Index of Consumer Prices (HICP) for September. On Wednesday, investors will turn their attention to U.S. employment data. The U.S. will release the ADP employment report, which shows the number of private jobs created in September. Before Friday's Nonfarm Payrolls (NFP) report, the U.S. will also release other labor market data, a key indicator of the overall labor market situation and a hint toward the Federal Reserve’s next monetary policy decision.
Based on the technical analysis of the weekly chart, EUR/USD risks remain tilted to the upside. The pair's highs and lows are moving higher, usually indicating buyer dominance. At the same time, the pair has been developing above all moving averages. The 20-week and 100-week simple moving averages are trending higher below the 1.0900 level, while the mildly bearish 200-week simple moving average provides dynamic support around 1.1047. Lastly, the 14-week Relative Strength Index (RSI) remains well above the midline at 64.68. Although the upward momentum is fading, there are no signs of exhaustion. EUR/USD could extend its gains, but it must clearly break through the 1.1200 psychological level and 1.1213 (the 2024 high). Once it breaks through this resistance zone, the next targets would be 1.1275 (the July 14, 2023 high) and 1.1300 (the psychological level). If the 1.1100 area fails, EUR/USD might find support around 1.1083 (last week's low), then fall toward 1.1047 (200-week moving average) and the critical 1.1000 psychological level.
Today, consider going long on the U.S. dollar around 1.1150, with a stop loss at 1.1135 and targets at 1.1190 and 1.1200.

GBP/USD
Over the past week, GBP/USD achieved its third consecutive month of gains, reclaiming the 1.3400 threshold, maintaining its highest level since March 2022. GBP/USD entered a bullish consolidation phase between 1.3435 and 1.3250, sitting at a 30-month high, supported by the monetary policy divergence between the Bank of England (BoE) and the U.S. Federal Reserve (Fed). The cautious comments from BoE policymakers contrasted with a series of clear dovish remarks from Fed officials, which sustained hopes of a 50-basis-point Fed rate cut in November. Meanwhile, the market expects the BoE to cut rates by 25 basis points in November. On the economic front, last week's data was lackluster, but the upcoming week will be busy, with the U.S. set to release several top-tier statistics. In contrast, the UK’s schedule remains free of relevant macroeconomic news. Early in the week, the U.S. ISM Manufacturing PMI and JOLTS Job Openings report will catch attention, followed by speeches from Fed officials Raphael Bostic and Lisa Cook. Traders will focus on the critical non-farm payroll (NFP) data due on Friday. Fed speeches and developments in Middle East geopolitics will continue to drive USD movements, which will, in turn, influence the GBP/USD pair.
From the daily chart perspective, GBP/USD extended its upward movement, breaking through the descending trendline resistance located at 1.3199 and briefly reclaiming the 1.3400 level. With no solid resistance in sight, the path of least resistance appears to be to the upside. GBP bulls may aim to challenge the initial obstacle at the 1.3500 psychological level, followed by a push toward the February 24, 2022 high at 1.3550 and 1.3540 (the upper trendline of the daily chart's ascending channel). A break above this level would open the door for a test of the February 2022 high at 1.3644, with the next bullish target at 1.3700. Additionally, the 14-day Relative Strength Index (RSI) remains in the bullish zone, well above the 63 level, signaling room for further gains. On the downside, any pullbacks are likely to find initial demand at the September 23 low of 1.3250. A break below this level would challenge the 1.3200 and 1.3207 levels (the 21-day simple moving average), which have now turned into support. Further declines could target the area around the 34-day simple moving average at 1.3149, with the 50-day moving average at 1.3041 acting as the final defense for buyers.
Today’s recommendation is to go long on GBP around 1.3360, with a stop loss at 1.3345, and targets at 1.3400 and 1.3410.

USD/JPY
By the end of last week, the Japanese yen saw a significant rebound, suggesting that market participants expect a victory by new Prime Minister Shigeru Ishiba, which could favor further rate hikes by the Bank of Japan. In previous comments to Reuters, Ishiba stated that the central bank's rate hikes are "on the right policy track" so far. Meanwhile, after weaker-than-expected U.S. Personal Consumption Expenditures (PCE) data for August, the U.S. dollar weakened sharply, pushing the yen further up. Annual PCE inflation fell to 2.2%, faster than the expected 2.3% and down from 2.5% in July. Core PCE, the Fed’s preferred inflation gauge excluding volatile food and energy prices, is expected to rise by 2.7%. The U.S. Dollar Index, which tracks the dollar's value against six major currencies, plummeted near the year-to-date low of 100.16. Further dollar weakness could lead to a new bearish cycle. As U.S. inflation pressures continue to ease, market expectations are rising for the Fed to cut rates by another 50 basis points in November. Due to growing concerns over worsening job growth, the Fed shifted towards policy normalization with a larger-than-usual 50-basis-point rate adjustment last week.
The technical structure on the daily chart is weakening, as the 14-day Relative Strength Index (RSI) is about to drop from 53.00 to 41.42 into negative territory, signaling that USD/JPY has minimal resistance to the downside. The simple moving averages have resumed a fully bearish setup, with a double bull trap forming above 144.82 (the 23.6% Fibonacci retracement from 161.80 to 139.57). Last Friday’s close formed a bearish “engulfing” pattern, putting pressure on the recent rebound. A daily close below 141.25 (the middle line of the descending channel on the daily chart) would strengthen the bearish signal and could push new shorts firmly toward 140.32 (the September 17 low) and 140.00 (a key psychological level). A break below these levels would bring the previous low of 139.58 back into focus.
On the flip side, if USD/JPY reclaims the 142.70 level (14-day moving average) and breaks above the 142.90 level (the lower boundary of the daily ascending channel), the next target would be 144.20 (the lower boundary of the descending channel). A move to 146.50 (last Friday’s high) could signal further upside, though, given the limited momentum, the chances of reaching the next major resistance level at 147.00 are currently slim.
Today's recommendation is to go short on the U.S. dollar around 142.50, with a stop loss at 142.80 and targets at 141.50 and 141.30.

XAU/USD
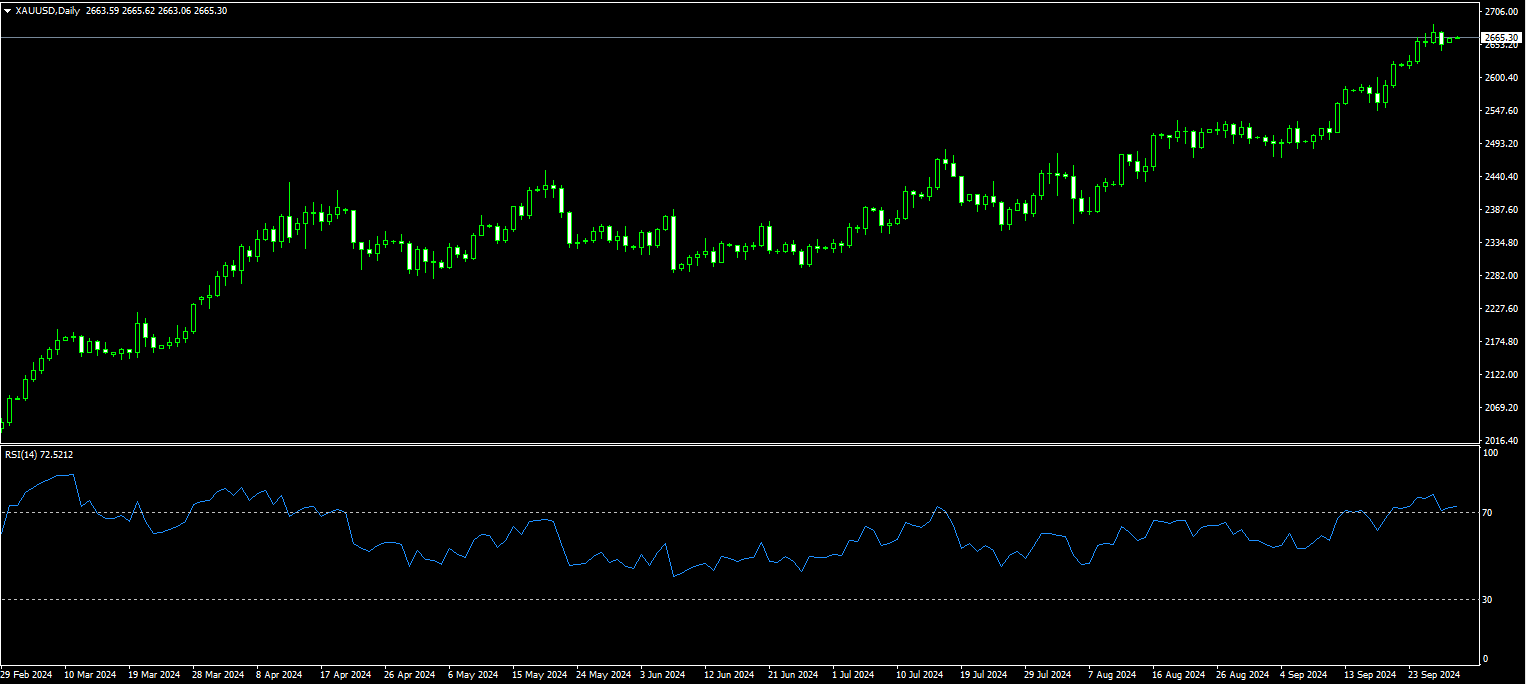
By the end of last week, after the U.S. Personal Consumption Expenditures (PCE) inflation data fell short of expectations, gold pulled back below $2,660 per ounce, following its earlier all-time high of $2,685. The anti-inflationary trend suggests that the Federal Reserve will continue its steady pace of rate cuts, which benefits gold as a non-interest-bearing asset. Earlier this year, I predicted that 2024 would be the "Year of Metals" and that gold would surpass $2,600 per ounce. Nine months later, there is solid evidence that gold has not only performed exceptionally well this year but is also on track to have its best year ever. As gold prices resume their epic climb, reaching new record highs week after week, we are witnessing history in the making as gold continues to push toward unprecedented levels. This year's gold market has been undeniably hot, with prices soaring to an all-time high of around $2,685 per ounce. Since October of last year, gold has been in a parabolic run, rebounding from around $1,800 and setting new record highs 37 times so far in 2024. Last week, gold surged to a historic high of $2,685 per ounce, marking an astonishing 50% gain over 11 months.
The daily chart shows that gold is currently in overbought territory, with the 14-day Relative Strength Index (RSI) hovering around 72.35, which opens the door for a short-term correction. However, the constructive outlook does not appear to have weakened. The all-time high of $2,685 (Thursday’s peak) poses an immediate upside barrier, followed by $2,697 (the upper boundary of the ascending channel) and the psychological level of $2,700. Once this level is breached, the Fibonacci extension for the 2024 uptrend would target $2,876, with the next milestone at $3,000 (the 2025 target price). If sellers regain some control, the first support level is at $2,635 (the 23.6% Fibonacci retracement from $2,471.90 to $2,685.50), followed by $2,600 (a key psychological level) and $2,597.10 (the 14-day moving average), which will see initial contention. Further declines could target $2,578.50 (the 50% Fibonacci retracement level). The next target would be $2,750, with most medium-term market targets now aiming for the $3,000 level.
Today’s recommendation is to go long on gold around $2,654.00, with a stop loss at $2,650.00, and targets at $2,670.00 and $2,675.00.
XTI/USD
By the end of last week, tensions in the Middle East escalated, leading to a rise in oil prices. However, for the week, U.S. crude oil fell by 5.2%, marking its first weekly drop in three weeks. The prospect of increased oil supply from Saudi Arabia put overall pressure on prices, while news of economic stimulus measures from China limited the decline. Saudi Arabia appears to have abandoned its challenging goal of achieving $100 per barrel, with rumors suggesting that the country might shift its focus to regaining market share. Voluntary production cuts may be lifted in December, bringing more oil to the global market. Libyan oil production could also rise, following a breakthrough in negotiations between rival factions, which, despite a significant drop in U.S. weekly inventories, would further weigh on oil prices. However, oil demand failed to meet expectations as China's economy struggled to gain growth momentum, and it may take some time before the full impact of stimulus measures is felt in the real economy. China, the world's largest crude oil importer in 2023, saw a year-on-year decline in crude imports in the first seven months of the year. Currently, the drop in crude imports is temporary, and as the world's second-largest economy, China's oil imports are expected to rise again once positive economic developments occur. However, it is important to note that structural changes in China's oil demand and a shift toward fuel consumption transformation could also hinder crude demand from reaching previous high levels.
Oil traders saw a small rebound to $68.40 on Friday after a sharp downward correction to a nearly three-week low of $66.80 late last week. With more supply from Saudi Arabia likely to hit the market, further economic slowdown seems inevitable, confirming the current downward trend. Technical indicators, such as the 14-week Relative Strength Index (RSI), fell to 37.50 last week, indicating that bearish forces remain strong in the market. The short-term target is $66.80 (last week's low). If oil prices break through $66.80, they could target $64.75 (the September 10 low) and $64.80 (the initial target of a "triple bottom" formed in March-April last year and this September). The overall trend remains bearish. If the momentum continues, oil prices may rise back to $69.24 (the 61.8% Fibonacci retracement from $33.84 to $126.51). A breakthrough of the psychological level of $70.00 would encounter resistance at $72.06 (the 9-day moving average) and $72.20 (last week's high).
Today, consider going long on crude oil around $68.20, with a stop loss at $68.00, and targets at $69.60 and $69.70.

Disclaimer:
The information contained herein (1) is proprietary to BCR and/or its content providers; (2) may not be copied or distributed; (3) is not warranted to be accurate, complete or timely; and, (4) does not constitute advice or a recommendation by BCR or its content providers in respect of the investment in financial instruments. Neither BCR or its content providers are responsible for any damages or losses arising from any use of this information. Past performance is no guarantee of future results.


