

EURUSD
Fundamental Perspective
The EURUSD pair surged past the 1.0800 mark, trading around 1.0820 after hitting a three-week high of 1.0841. This movement was driven by a weakened US Dollar, influenced by various factors, while Euro buyers remained cautiously optimistic. The US Bureau of Economic Analysis reported a steady monthly PCE Price Index and a 2.6% annual increase for May, suggesting no inflation acceleration. Fed Chairman Jerome Powell's unexpectedly dovish remarks at the ECB's Forum on Central Banking hinted at a possible September rate cut, further undermining the Dollar.
Employment data exacerbated the Dollar's decline. The ADP report showed the private sector added fewer jobs than anticipated, and Initial Jobless Claims rose slightly. Although Nonfarm Payrolls exceeded expectations with 206K new jobs, unemployment climbed to 4.1%, and wage growth decelerated. Additionally, disappointing ISM Services and Manufacturing PMI figures, both showing contraction, added to the Dollar's weakness.
In contrast, the Eurozone presented mixed economic data. Retail Sales saw a minor increase, and PMIs were revised upward, yet Germany's HICP inflation eased. German growth indicators, such as Factory Orders and Industrial Production, declined. Markets now await Powell's upcoming testimony and US inflation reports to determine future trends, keeping a close watch on potential market shifts.
EURUSD Forecast Technical Perspective
The last weekly candle closed in solid green, reflecting intense bullish pressure on the asset price, which indicates that the next candle might be another green one.
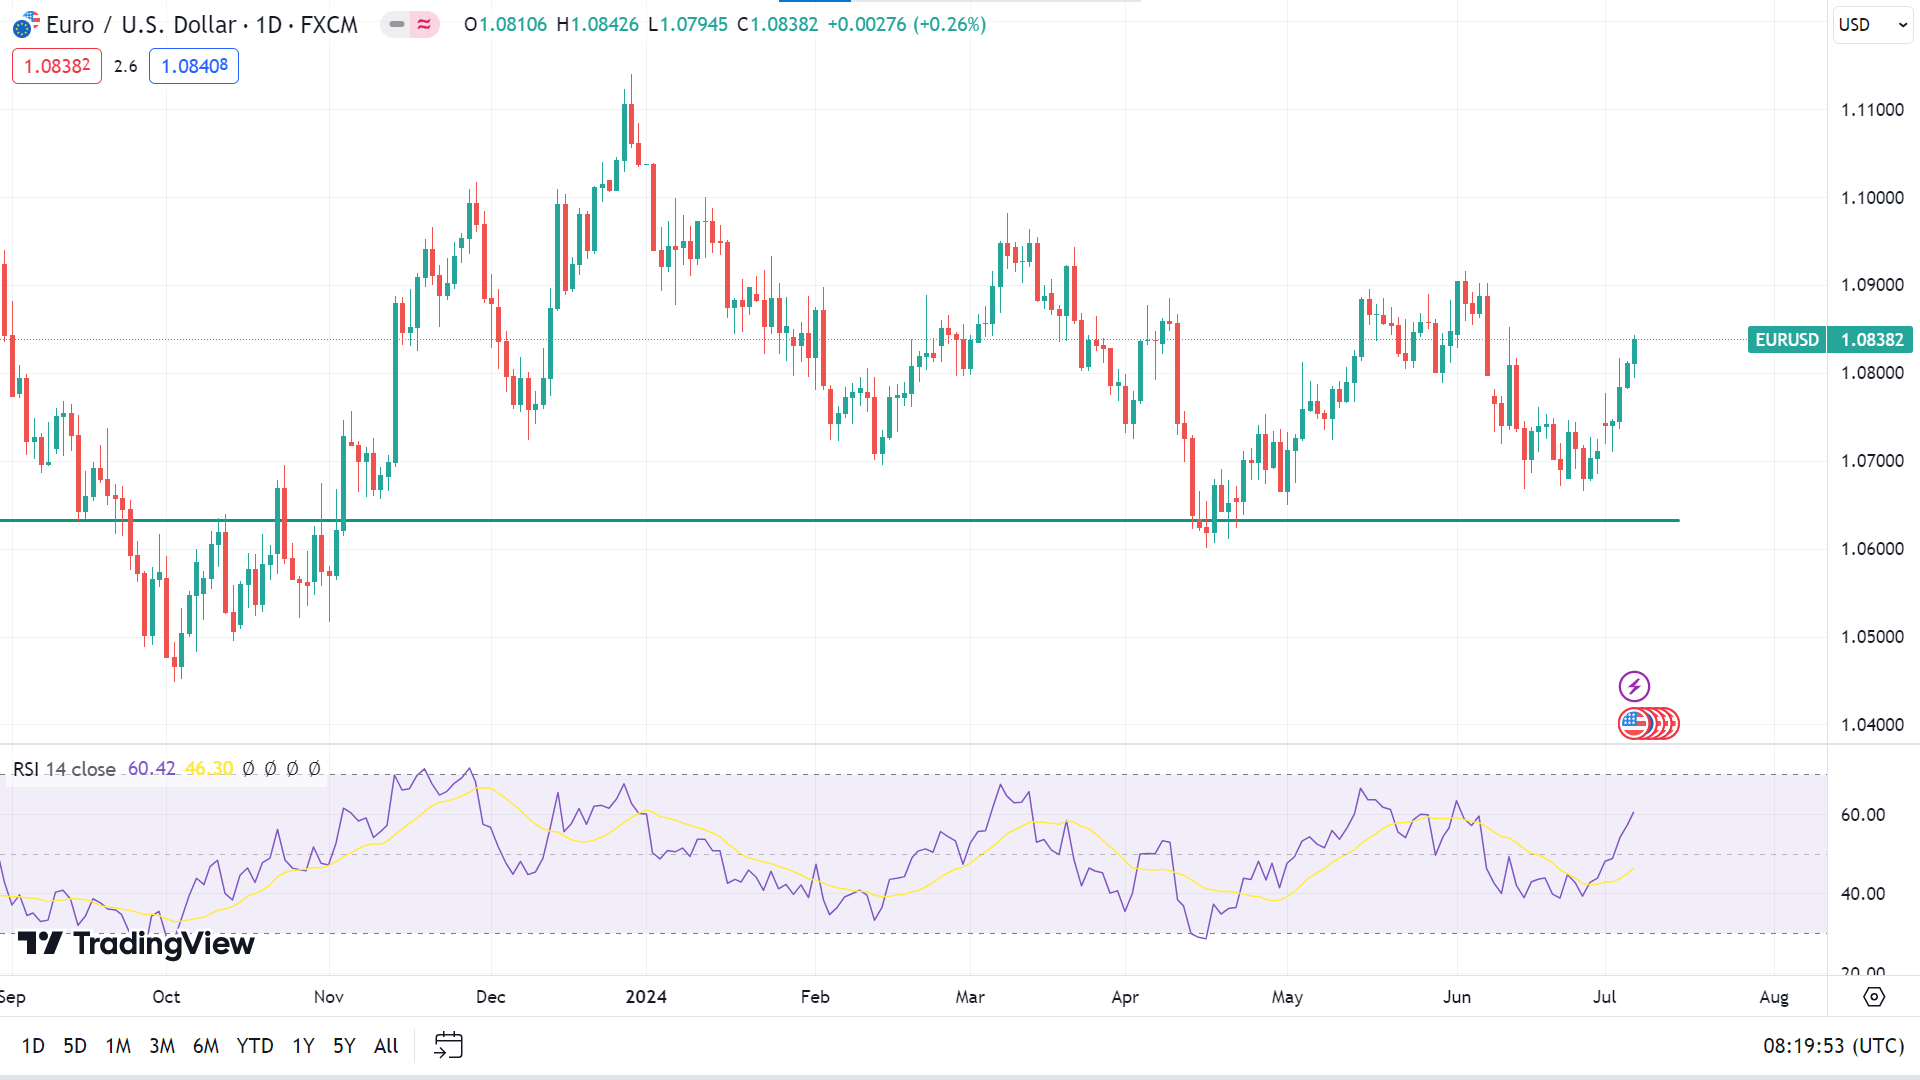
The RSI signal line is moving upward on the daily chart, reflecting the current bullish pressure on the asset price. This indicates that the price may regain the peak of 1.0918, followed by the next resistance near 1.1014.
Meanwhile, on the negative side, if the RSI signal line starts sloping toward the midline of the indicator window, the price can decline to the nearest support of 1.07284, followed by the next support near 1.0604.


