

EURUSD
Fundamental Perspective
The recent slide of the EURUSD pair below the 1.0700 mark reflects a complex interplay of economic indicators and political events affecting both the Eurozone and the United States. Political uncertainty in Europe, highlighted by far-right gains in France, Austria, and Germany during the European Parliamentary Elections, has led to investor concerns about potential shifts in fiscal policies, immigration, and climate-change measures. This political instability prompted a move from the Euro towards the safe-haven US Dollar.
Meanwhile, US economic data has painted a mixed picture. Softer-than-expected inflation figures weakened the Dollar as markets speculated the Federal Reserve might ease its monetary tightening. However, the Fed's decision to maintain interest rates and cautious inflation outlook contributed to a Dollar rebound. Easing Producer Price Index figures and a drop in consumer sentiment further highlighted economic caution, yet they did not prevent the Dollar from strengthening as investors sought stability amidst global uncertainty.
Despite record highs in the S&P 500, European markets suffered, weakening both local stocks and the Euro. The EURUSD pair appears poised for continued volatility, influenced by upcoming economic data releases and ongoing political developments. Investors should remain vigilant, as these evolving factors will likely shape market sentiment.
EURUSD Forecast Technical Perspective
The last weekly candle closed with a red body and wicks on both sides, posing two consecutive losing weeks. This reflects bearish pressure on the asset price, increasing the possibility of a downside continuation.
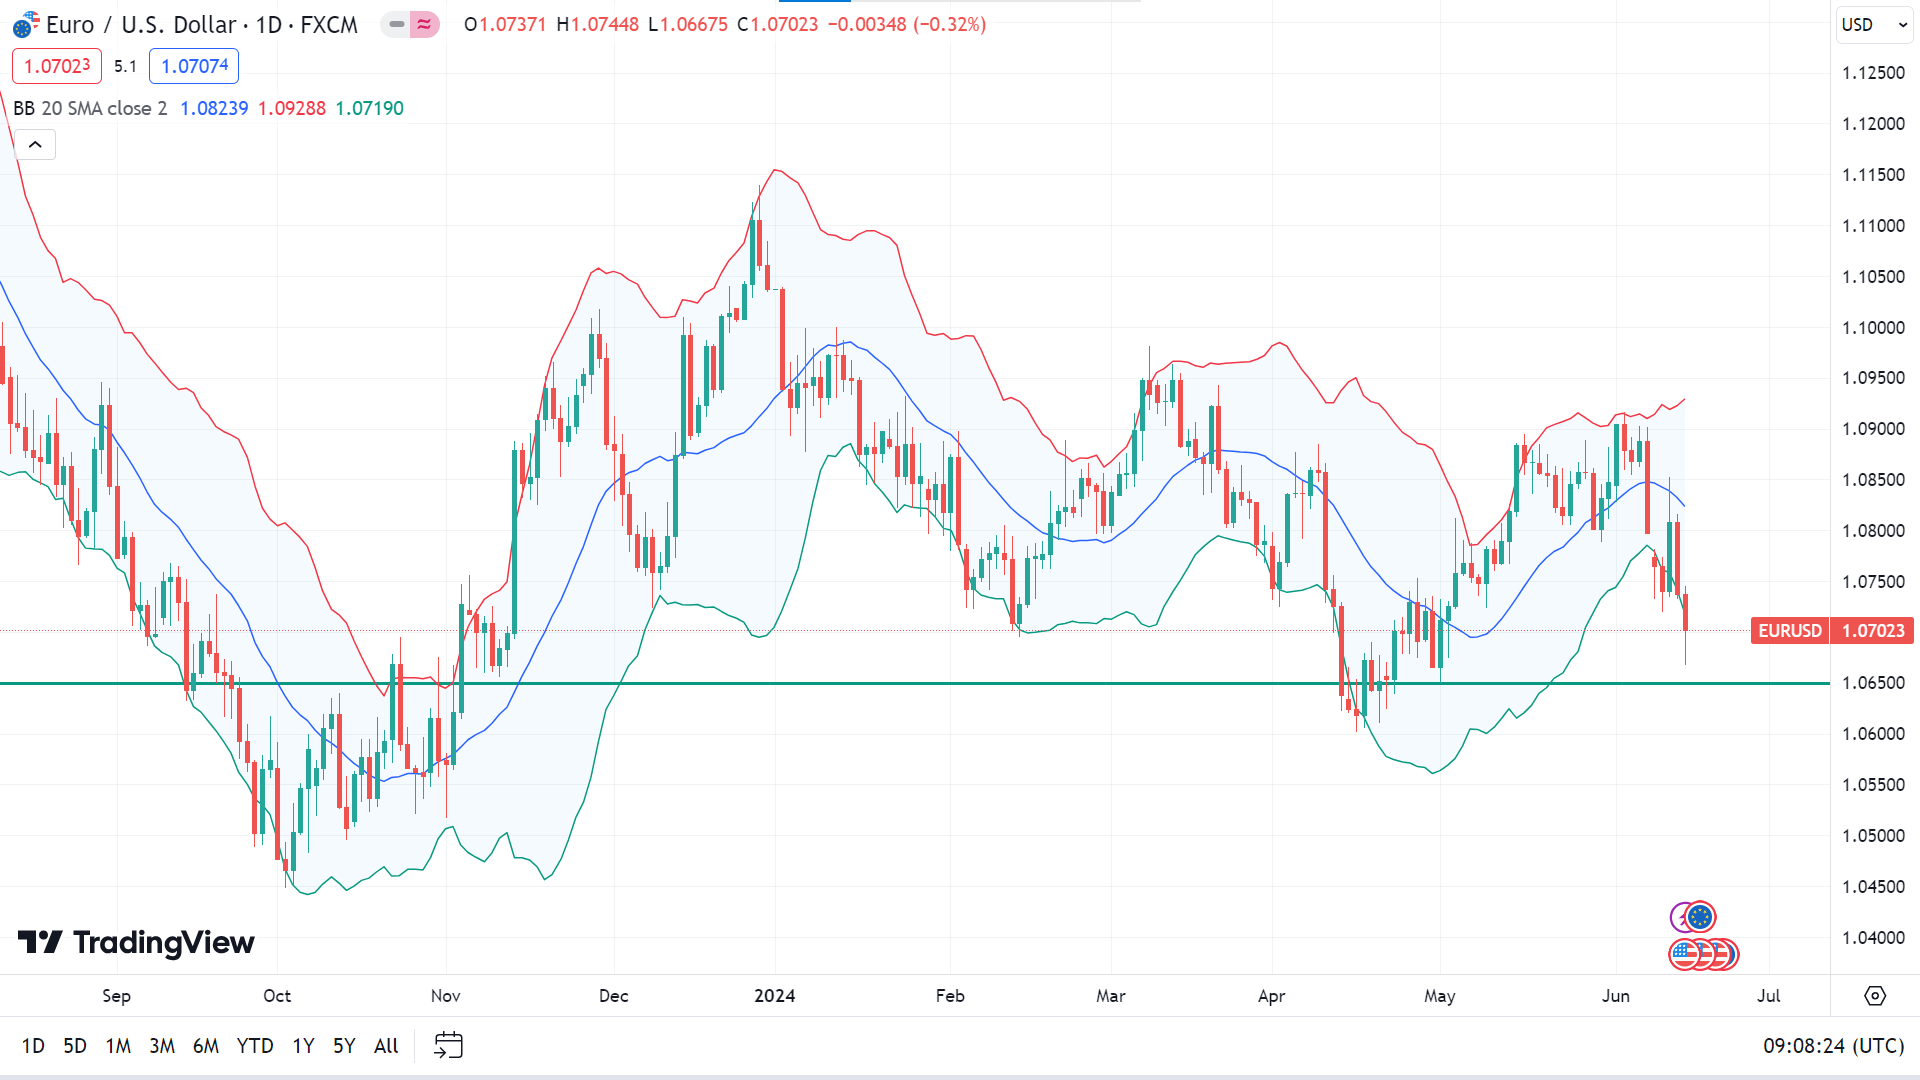
The price sinks below the lower band of the Bollinger Bands indicator, indicating significant bearish pressure on the asset price. In that case, the price may head toward the nearest support of 1.0650, followed by the next support near 1.0450.
Meanwhile, the lower band of the Bollinger Bands often indicates an oversold phase, indicating a pause may be expected in the current bearish trend, which can trigger the price to reach the nearest resistance of 1.0875, followed by the next resistance near 1.0981.


