

EURUSD
Fundamental Perspective
The EURUSD pair saw a notable rise as market optimism surged following softer-than-expected U.S. inflation data. In July, the U.S. Producer Price Index (PPI) increased by 2.2% year-over-year and 0.1% month-over-month, both figures coming in below forecasts and the previous month’s results. The core PPI also rose by a lower-than-expected 2.4% annually, leading to speculation that the Federal Reserve might initiate a loosening of monetary policy as early as September. This prospect caused a significant dip in the USD as traders adjusted their expectations.
Despite the initial optimism, the USD managed to recover some of its intraday losses, even as the July U.S. Consumer Price Index (CPI) showed a slight decrease in inflation. The CPI rose 2.9% annually, down from June’s 3%, with the core CPI at 3.2%, slightly below the previous month. While the data fueled speculation about a potential rate cut, the market remained divided on whether the Fed would opt for a 25 or 50-basis point reduction, with economic growth now playing a crucial role in the decision.
In contrast, Europe faces a more challenging economic environment. Investors expect the European Central Bank may continue cutting rates due to stubborn inflation, but recession concerns are growing, particularly in Germany, where economic sentiment has deteriorated significantly.
Technical Perspective
On the weekly chart, the last candle closed solid green after a small inverted hammer candle with a small red body, indicating a continuation of the previous uptrend, leaving optimism for buyers for the next week.
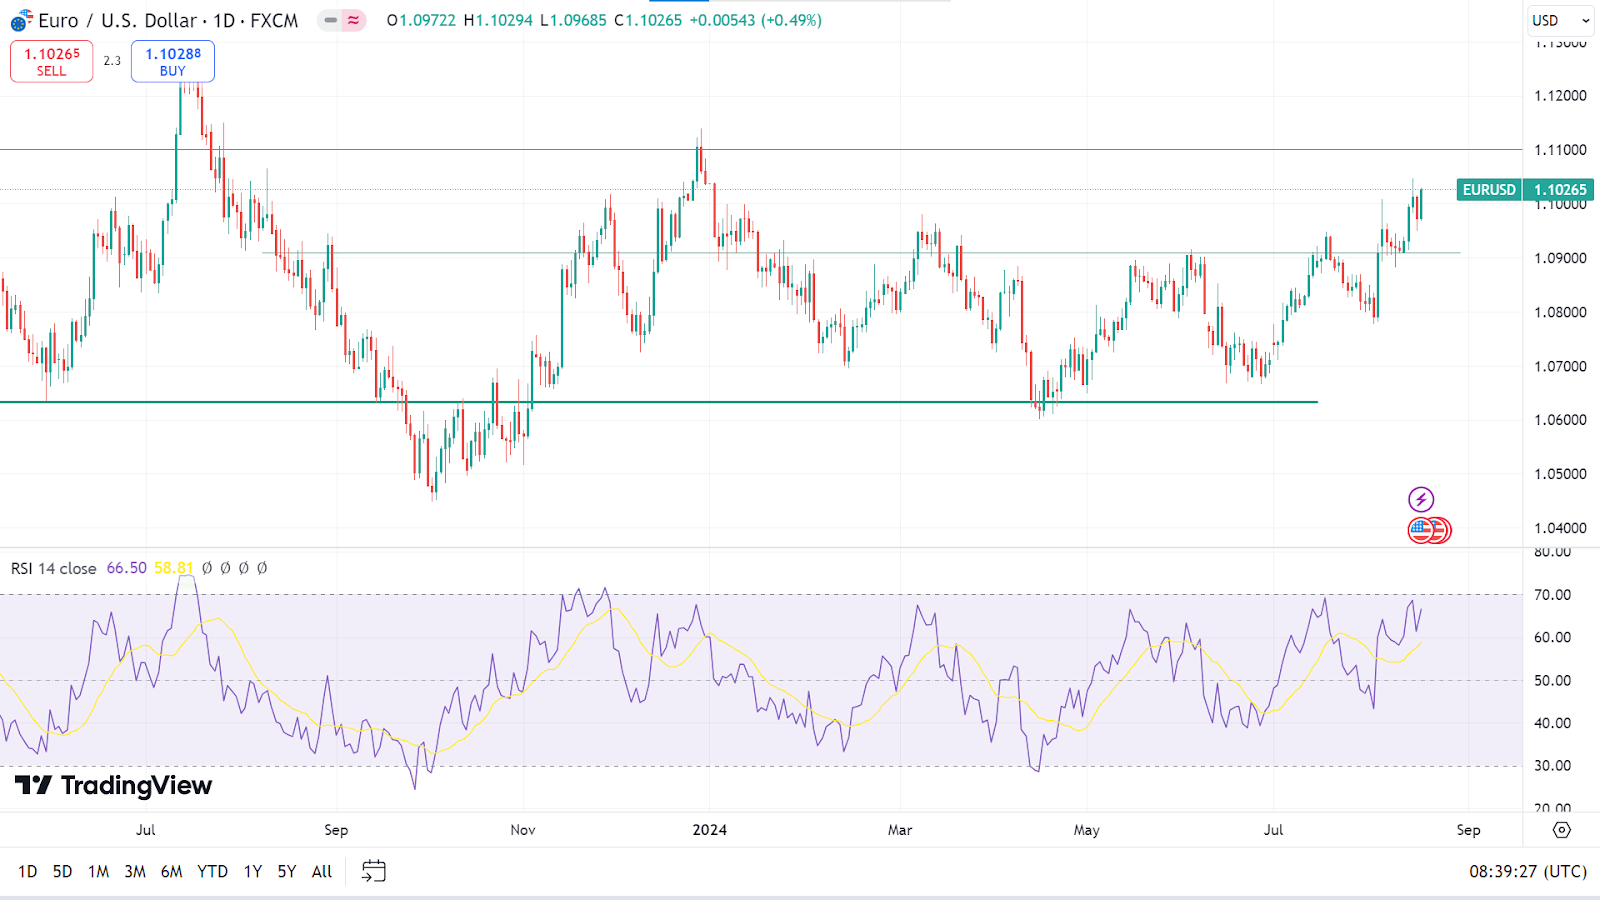
The RSI indicator window confirms the current bullish pressure on the asset price on the daily chart. The signal line edges upwards just below the indicator window's upper line, indicating the price may hit the primary resistance near 1.1100. Also, a breakout can trigger the price toward the next resistance near 1.1275.
Meanwhile, a pause in the current uptrend may cause the price to decline at the primary support level of 1.0910. If the RSI signal line edges further downside toward the midline of the indicator window, it can hit the next support near 1.0780.


