
I. Recent Eli Lilly Stock Performance
LLY Drug Sales Soared in 2024
The updated LLY price target from Geoff Meacham suggests a potential 25% increase from the Aug. 19 closing price of LLY, yet this is far from assured. Eli Lilly's stock price has increased by 58% in the current year, significantly influenced by tripeptide success, a drug marketed as Mounjaro for diabetes alongside Zepbound for weight management. This dual action of the drug on GIP and GLP-1 receptors has given it an edge over competitors, contributing to an 86% sales increase during Q2, 2024.
LLY Key Financial Metrics
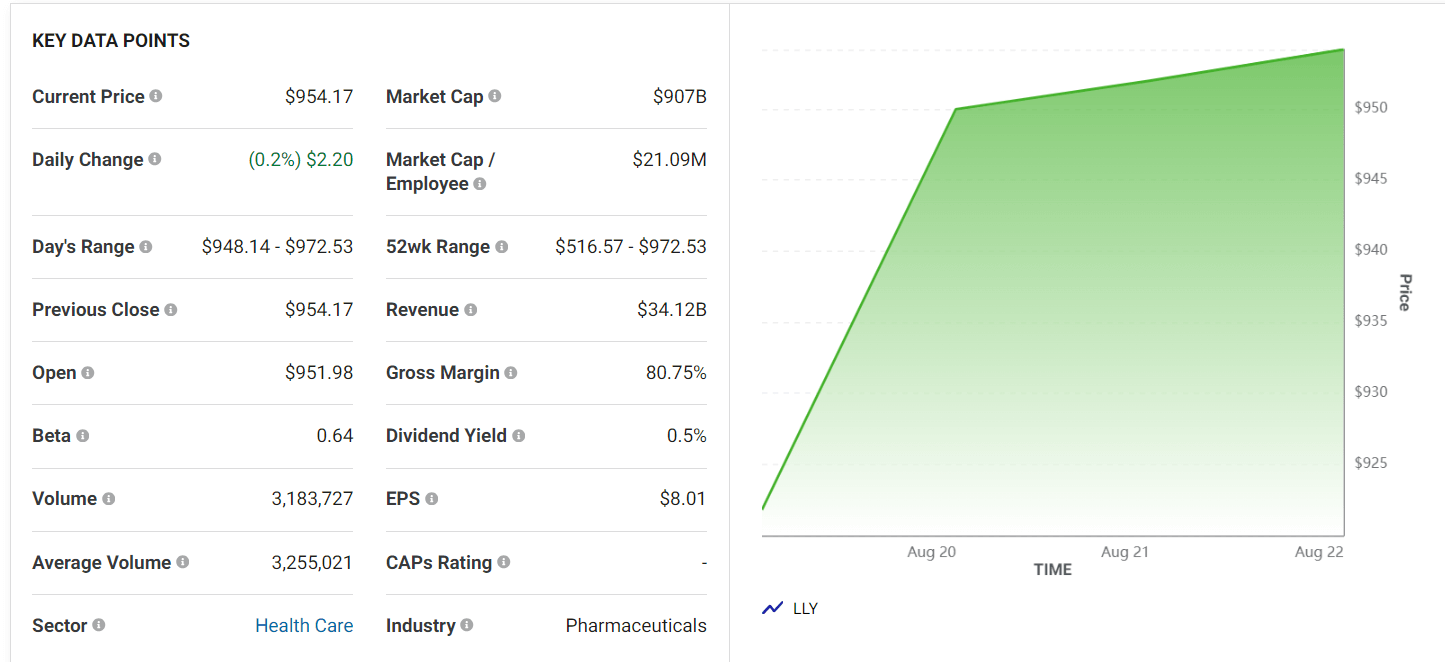
While Wall Street sentiment is bullish on the LLY stock, with analysts anticipating further growth, the stock price currently trades at approximately 60 times forward earnings. This high valuation not only presents market optimism but also reflects significant risk. The stock could gain considerably if drivers like Tirzepatide and Kisunla deliver as expected. However, setbacks could lead the stock to a sharp decline, making this a high-stakes investment. LLY might offer substantial rewards for those comfortable with risk, but smart financial investors may prefer to hold on till getting a potential entry point.
Expert Insights on Eli Lily Stock Forecast For 2024, 2025, 2030, and Beyond
LLY stock price is gradually moving on an uptrend. It faced a significant decline near 747.55 from the high of 966.10 in July but recovered from the loss and is now soaring near the ATH. Before checking further details, let's see what experts forecast about 2024, 2025, 2030, and Beyond:
|
Providers |
2024 |
2025 |
2030 and beyond |
|
Coincodex |
$1008.36 |
$1207.40 |
$3959.94 |
|
Youthcouncilofindia |
$1092 |
$1140 |
$1895 |
|
Coinpriceforecast |
$1157 |
$1437 |
$2540 |
|
Stockscan |
$1204.25 |
$1895.19 |
$2795.80 |
II. Eli Lilly Stock Forecast 2024
When writing, LLY stock price is 952.71, seeking to reach the previous ATH of 967.00. As many expert analysts anticipate, any breakout above that level can trigger the price to reach nearly 1150.00 by the end of 2024.
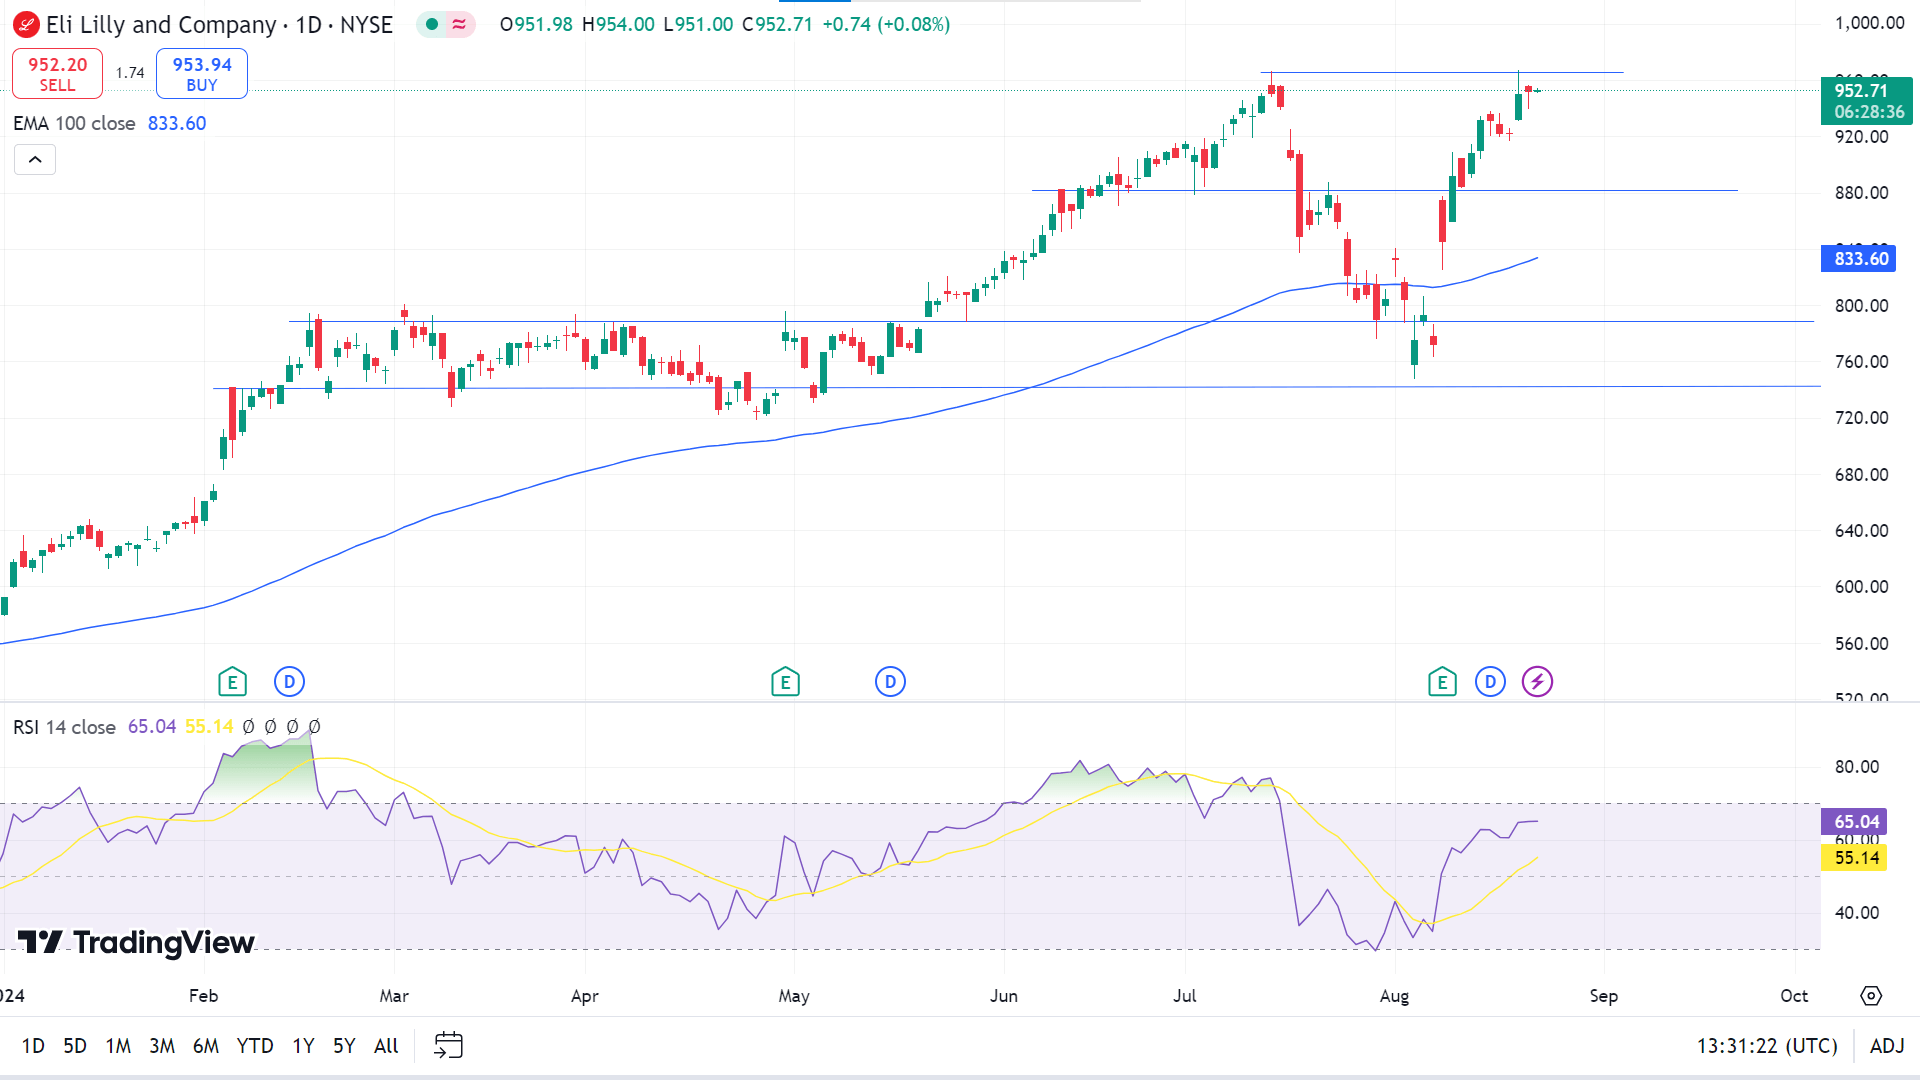
In the daily market trend, LLY trades within a stable bullish trend. The mid-2024 came with massive selling pressure. However, instead of a bearish continuation, the price formed a bottom and aimed higher with a bullish V-shape recovery. As long as the current bottom is valid, the upcoming price direction could be bullish for this stock.
Meanwhile, during this period, the downside risk is near 640.00. Looking at the daily chart, the price is floating above the EMA 100 line, reflecting bullish pressure. In contrast, the RSI indicator window supports positive price pressure as the dynamic signal line floats at 65.04, leaving buyers optimistic as the price may head toward a new ATH and meet analyst expectations.
In the meantime, the ADX indicator value of 27.14 indicates that bulls may lose power at this level and can return to the nearest support near 776.60. Any breakout can trigger the price toward the next support near 640.00.


