
I. Recent Block Inc Stock Performance
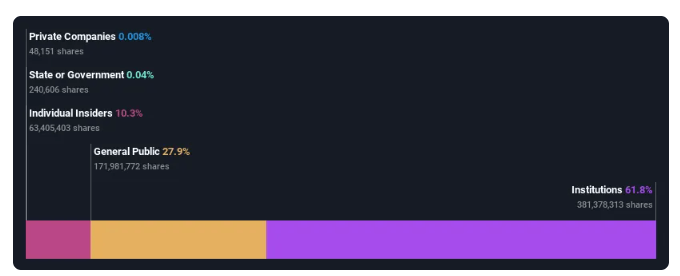
Block Inc Insider Holding
Block, Inc. (NYSE) has a market cap of $40.68 billion and operates a global commerce and financial services ecosystem.
The company generates approximately $15.93 billion in revenue from Cash App and $7.38 billion from Square. Its projected annual growth is 32.6%, which remarkably outpaces the 15% of the US market average. Although the recent insider selling was a matter of concern, the company remained profitable and is currently trading only below 12.6% of the fair value estimation. It posted a solid earring in Q2, with a net income of $195.27 million and a revenue growth of $6.16 billion, reflecting efficient operational improvement and robust profitability, significantly recovering from the previous year's loss.
SQ Business Model
Block Inc., formerly known as Square, has become a leading company in the technology and financial service sector. Initially, the company focused on enabling small businesses to accept card payments, but it has now reached far beyond that.
The Square segment, which caters to merchants, now offers more than just point-of-sale hardware. It provides various financial services and software solutions, including invoicing, marketing tools, and loans. Square generated a profit of $3.1 billion in 2023, which is 42% of the total profit that the company made.
On the consumer side, the Cash App, which enables individuals to manage banking services, was launched in 2013. This platform has 57 million active users and generated notable profit growths that outpaced Square in 2023 and Q1 this year.
However, Block isn't just focusing on managing these two ecosystems. The company's leading authority is now focusing on integrating Cash App and Square to create a more unified business. The acquisition of Afterpay, a buy-now-pay-later company, in 2022 was a crucial step in this direction.
Expert Insights on SQ Stock Forecast for 2024, 2025, 2030 and Beyond
The company was formed in 2009 and went public after six years. The SQ stock price hit a high near 289.23 back in 2021, then declined and has been sideways since then. Before checking on details on the SQ stock price Forecast for 2024, 2025, 2030, and Beyond, let's see what analysts think about SQ stock:
|
Providers |
2024 |
2025 |
2030 & beyond |
|
Exlaresources |
$75 |
$94.72 |
$536.65 |
|
Coinpriceforecast |
$63.83 |
$72.40 |
$144.16 |
|
Stockscan |
$69.00 |
$155.91 |
$45.22 |
|
Coincodex |
$59.97 |
$85.02 |
$485.95 |
II. SQ Stock Forecast 2024
The SQ stock price is floating at 61.40 when writing, heading toward reaching the resistance levels, which can end up reaching 86.50 by the end of 2024.
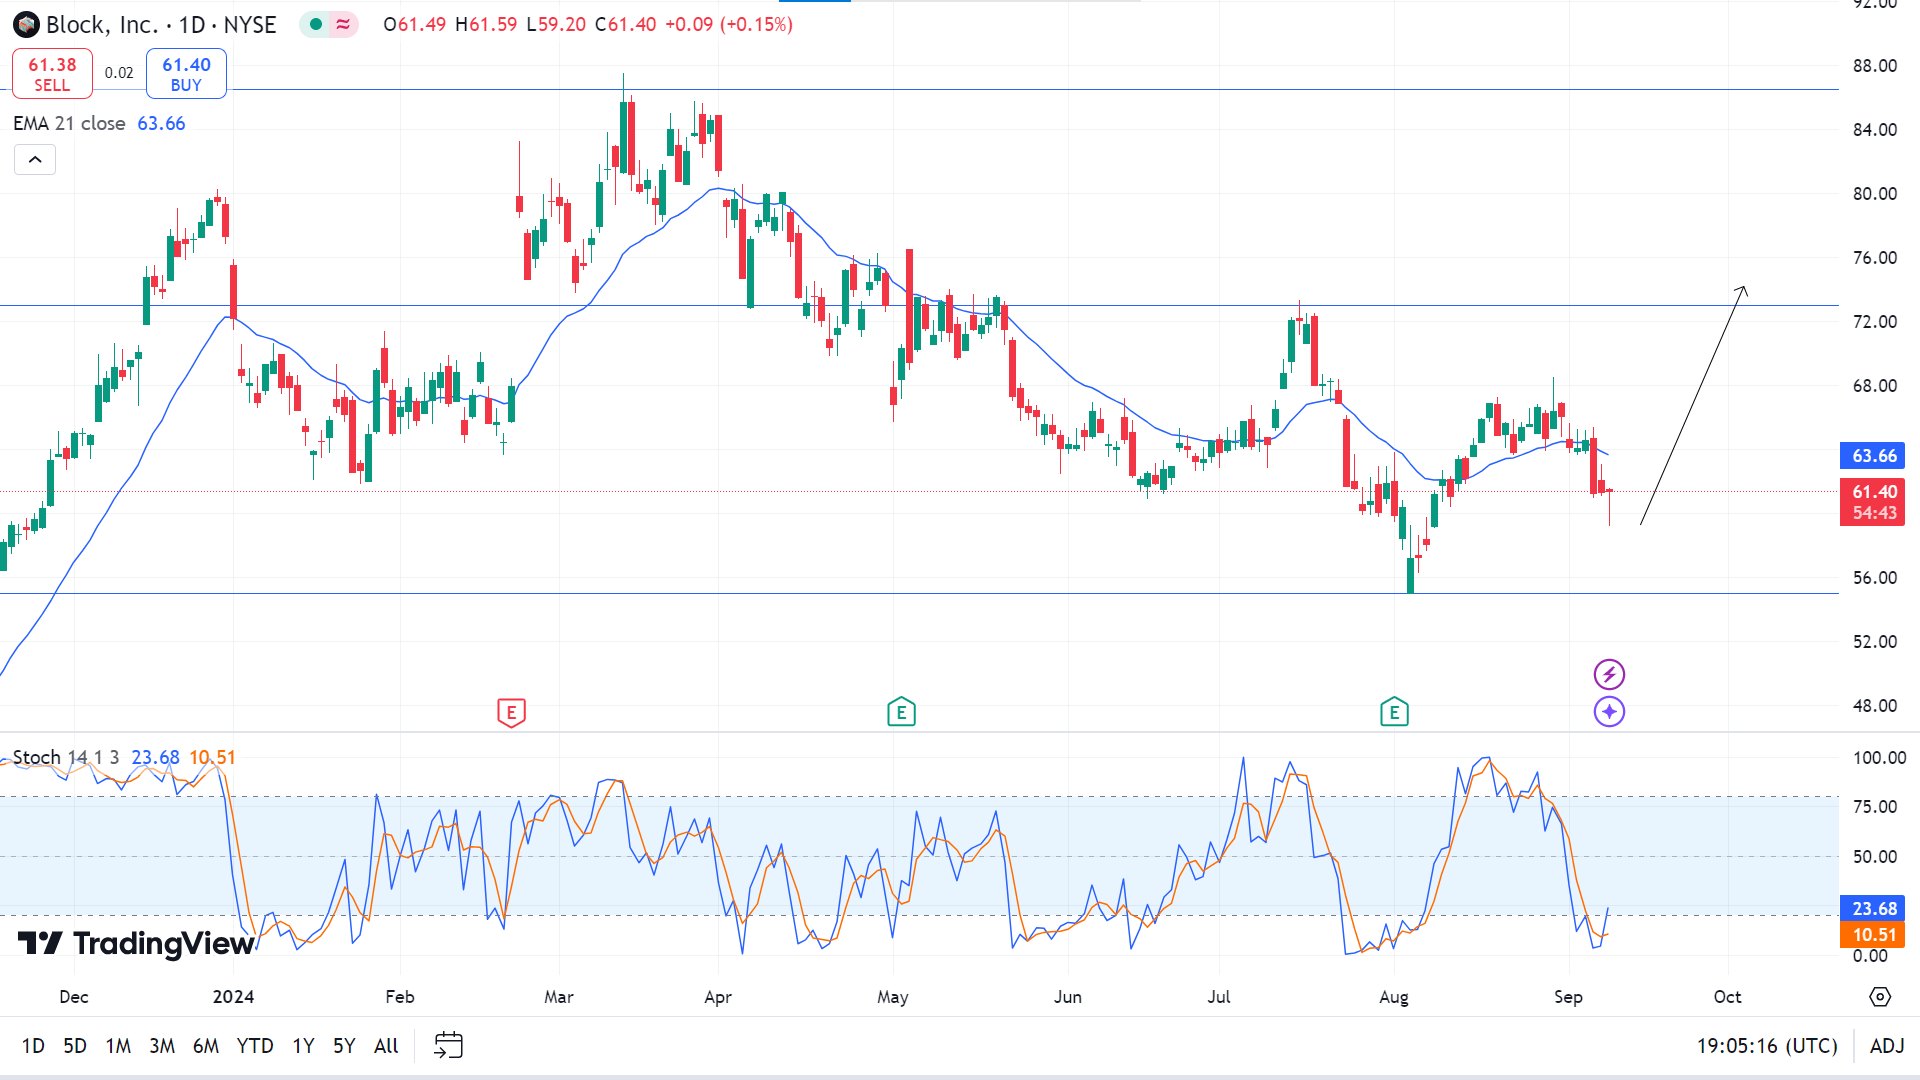
The primary support level is near 55.00, which is the bounced-back level in August. Looking at the daily chart, the price is just floating below the EMA 21 line due to recent bearish pressure, whereas the Stochastic indicator window signals differently.
Based on the SQ Stock Forecast 2024, the price can reach the primary support of 55.00 level before touching the resistance levels when the next possible support is near 43.71.
On the other hand, the Stochastic indicator window shows fresh bull activity. The dynamic signal lines create a bullish crossover below the lower line of the indicator window, reflecting fresh bullish pressure on the asset price. If these signal lines continue moving upward on the indicator window and the price exceeds the EMA 21 line, it can soon hit the nearest resistance near 73.00. Any breakout can trigger the price to reach the next desired resistance of 86.50 by the end of the current year.


