

EURUSD
Fundamental Perspective
The EURUSD pair showed volatility throughout the week, briefly climbing to a high of 1.0629 on Friday before settling near 1.0570. The U.S. Nonfarm Payrolls (NFP) report initially weakened the dollar, but the losses were quickly reversed. Strong labor market data, with 227,000 jobs added in November, exceeded expectations but slightly increased the unemployment rate to 4.2%. Concerns about inflation re-emerged as average hourly earnings outpaced forecasts, adding complexity to the Federal Reserve's upcoming policy decisions.
Complementing the NFP data, other indicators reflected a mixed picture. As the ADP report shows, job openings increased in October, but private-sector hiring fell slightly below expectations. Initial jobless claims rose above forecasts, while layoffs increased, hinting at emerging pressures. The ISM Manufacturing PMI suggested resilience with a stronger-than-expected rebound, though the services sector disappointed with an unexpected contraction.
ECB President Christine Lagarde highlighted weak near-term growth prospects in the Eurozone but projected a gradual recovery. Inflation is expected to rise temporarily before easing, aligning with targets. The ECB, widely anticipated to cut rates by 25 basis points on 12 December, faces additional challenges from political turmoil in France, adding layers of uncertainty to the Euro's outlook as market participants await further clarity.
Technical Perspective
The last weekly candle closed as a doji candle, following a green candle. This reflected a pause in the downtrend, making traders aware of the need to confirm the next price movement to determine adequate trading positions.
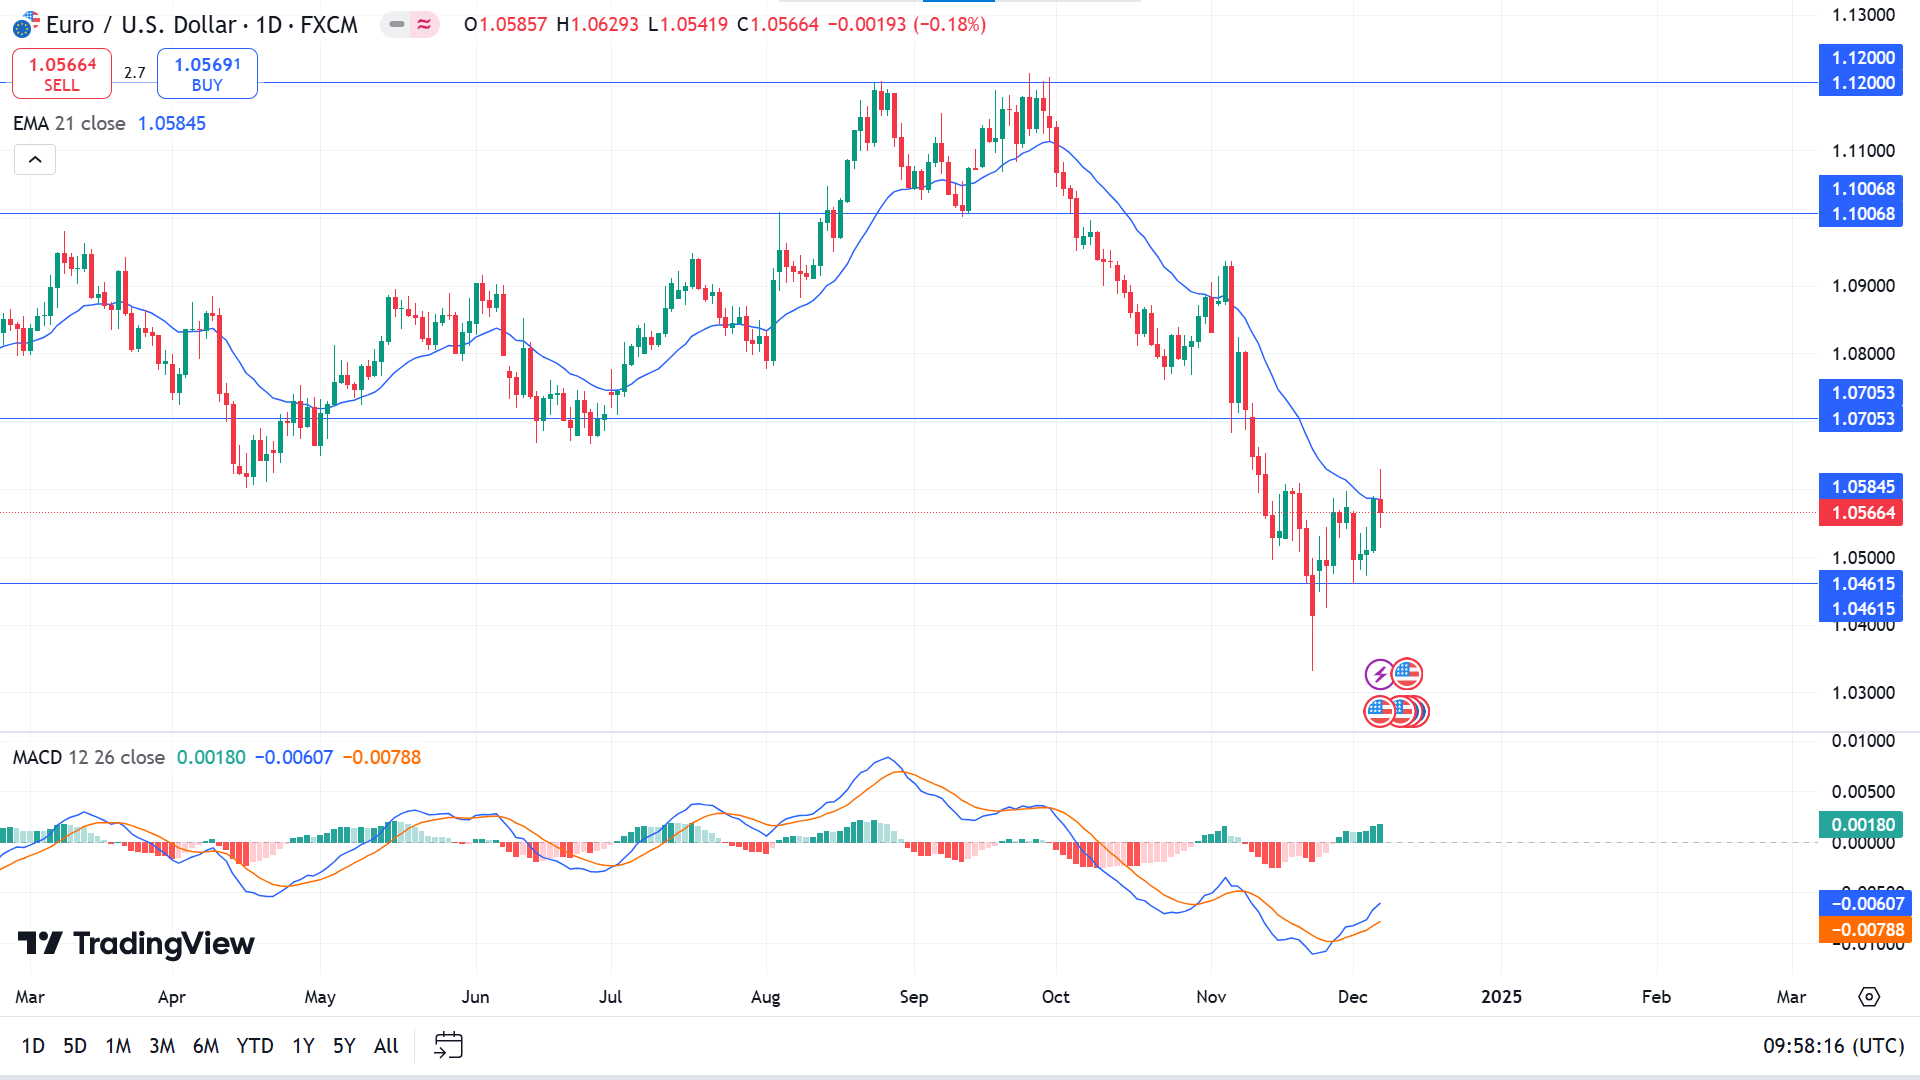
The price moved below the EMA 21 line on the daily chart confirming the downtrend, while the MACD indicator reading turns bullish. The Dynamic signal lines create a bullish crossover below the midline, and the green histogram bars above indicate a positive force.
Following the ongoing bearish trend, price action traders may seek to open short-term sell positions, targeting the 1.0342 level.
Meanwhile, the recent price showed a bullish V-shape recovery from the yearly low. In that case, a green candle closing above the 1.0705 level might invalidate the bearish signal and find resistance from the 1.1000 psychological line.


