

EURUSD
Fundamental Perspective
The EURUSD pair edged higher in thin trading after the Christmas and Boxing Day holidays. This upward move was supported by a softer US Dollar (USD), even as the Federal Reserve (Fed) is expected to ease monetary policy gradually. Inflation has slightly recovered over the past three months.
The US Dollar Index (DXY), which tracks the USD against a basket of six major currencies, faced difficulty holding the crucial 108.00 support level. The USD had shown strength in recent months, bolstered by expectations of robust economic growth under the incoming US administration and speculation of a more measured pace in the Fed's rate cuts.
The Fed's latest dot plot suggests that policymakers anticipate the federal funds rate to reach 3.9% by the end of 2025, implying two rate cuts next year, down from the previously expected four. However, BCA Research analysts predict the Fed will lower rates by over 50 basis points in 2024, citing inflation expectations falling short of the 2% target and unemployment surpassing the Fed's 4.3% forecast.
Meanwhile, US Initial Jobless Claims data for the week ending December 20 showed a surprising decline to 219K, slightly below the prior figure of 220K and well under the expected 224K, signaling resilience in the labor market.
Technical Perspective
The last weekly candle closed as a small red candle, posting three consecutive losing candles, suggesting a pause in the current downtrend. Sellers are still optimistic but keep a keen eye on the sell barrier level before opening buy positions, as the weekly pattern suggests a trend-changing environment.
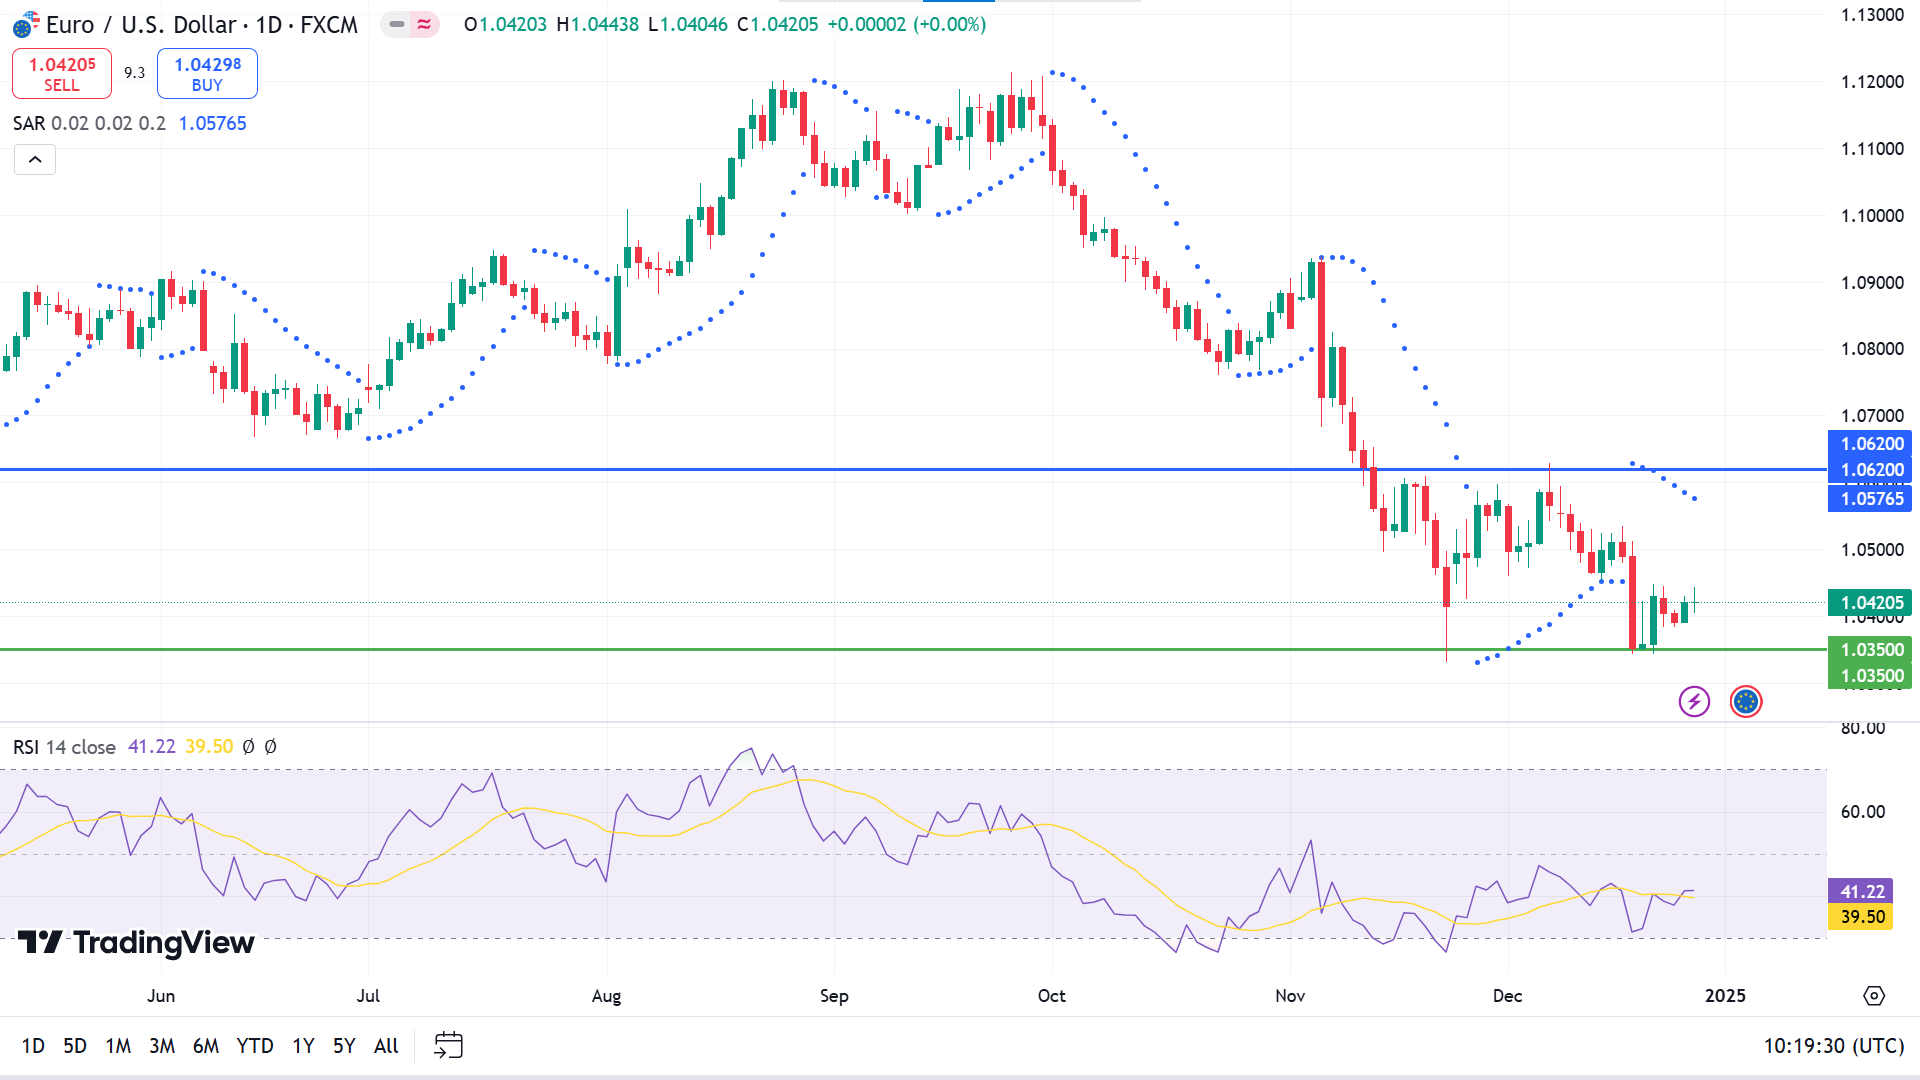
The price has remained downtrend since October and has been consolidating since November, above an acceptable support level of nearly 1.0350. The parabolic SAR continues creating dots above the price candles, declaring the recent bearish pressure, and the RSI indicator reading remains neutral. The RSI dynamic signal line floats below the midline, edging upside.
According to the current scenario, expert buyers may seek to open long positions near the adequate support of 1.0350, which can turn the price to a top range of 1.0620. A valid breakout can drive the price toward the next resistance near 1.0926.
On the other hand, the bullish signal might be invalidated if a daily red candle closes below 1.0350, which can drive the price toward the next support near 1.0138.


