
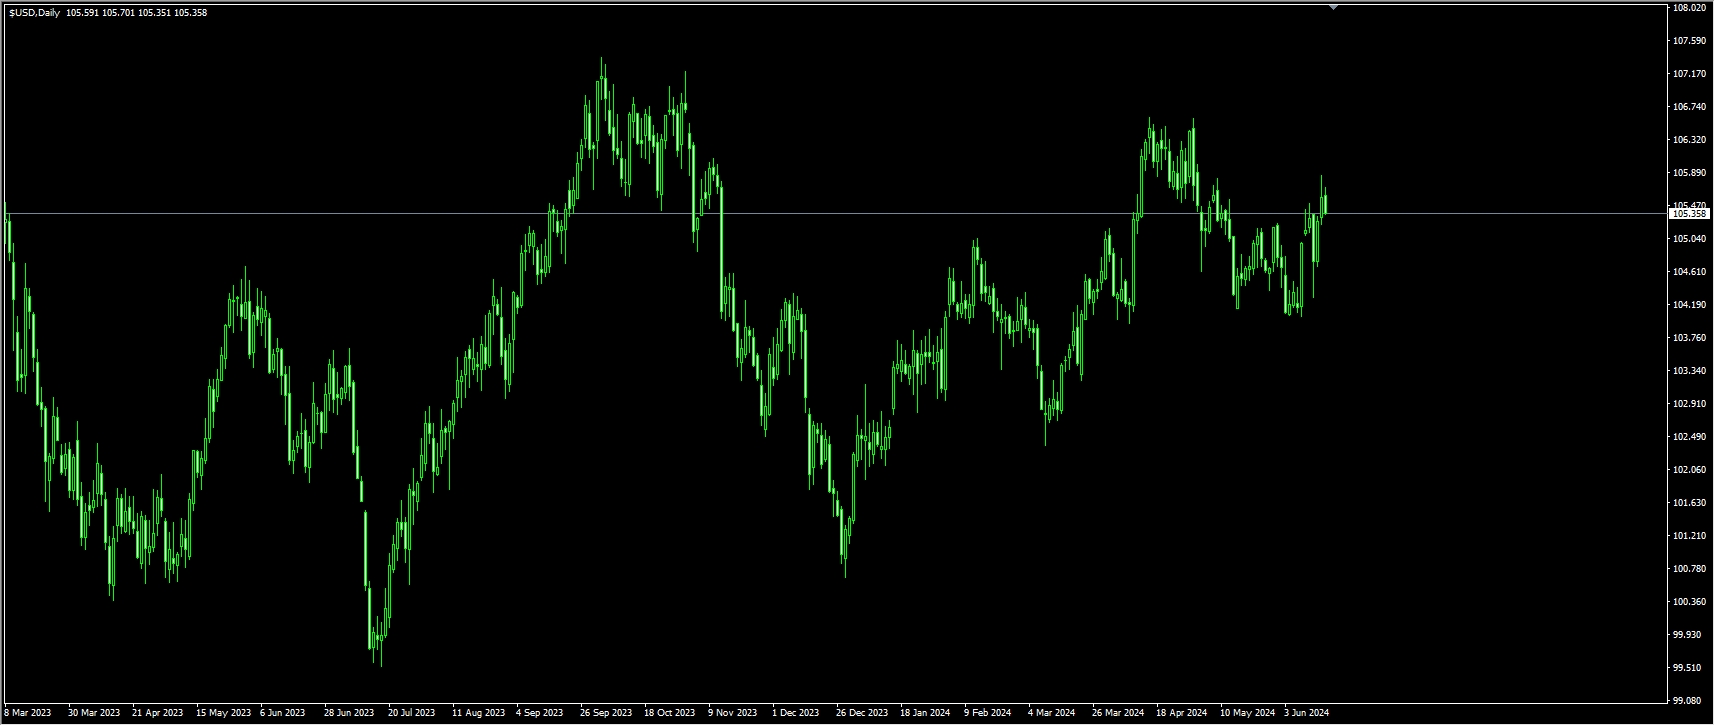
USD Index
On Monday, the USD Index experienced a slight pullback but remained generally strong. Following its performance from the previous week, the USD Index was influenced by the Federal Reserve's hawkish stance and European risk aversion. These two driving factors are expected to continue influencing the index, causing the USD to keep rising. Notably, the index closed at its highest level since early May on Friday, and it is expected to retest the early May high near 106.50. Last week, the USD Index performed quite positively, reaching levels near 105.81 by the end of the week, a level last seen in early May. In fact, the index has risen for the second consecutive week, supported by renewed political panic in Europe and the prospect of continued tightening by the Federal Reserve.
The U.S. May Consumer Price Index (CPI) inflation data came in lower than expected, which briefly caused a significant retreat in the USD. The Federal Open Market Committee (FOMC) is inclined to cut interest rates only once this year, mainly in December.
From a technical perspective, as of last Friday's trading session, technical indicators maintain a positive outlook. The 14-day Relative Strength Index (RSI) remains above 50, and the Moving Average Convergence Divergence (MACD) continues to reflect green signal bars. This suggests a further short-term rebound for the USD Index. Additionally, the index is above the 20-day (104.74), 100-day (104.52), and 200-day (104.46) Simple Moving Averages (SMAs). These combined factors reinforce the bullish outlook for the USD Index. Thus, on the upside, attention can be given to 106.00 (market psychological threshold), with the next level targeting 106.51 (April 16 high). On the downside, support can be noted at 105.00 (round number threshold), followed by the 20-day (104.74) and 100-day (104.52) SMA levels.
Today, consider shorting the USD Index near 105.50, with a stop loss at 105.65 and targets at 105.10 and 105.05.
WTI Spot Crude Oil
On Monday, U.S. WTI crude oil continued to rise, reaching around $80.40. With the reduction in fossil fuel use, the recovery in demand faces significant challenges in the medium term. Against the backdrop of turmoil in the European bond market, the USD Index traded above 105.50. The decline in oil prices was supported by weak U.S. consumer demand and sluggish industrial production data from China. According to the preliminary report released on Friday, the Michigan Consumer Sentiment Index fell to a seven-month low in June. The Consumer Sentiment Index dropped from a final value of 69.1 in May to 65.6 in June. This figure was below expectations of 72.0. Affected by this data, WTI prices dipped slightly due to concerns about personal finances and inflation. Additionally, the Fed's hawkish signals boosted the dollar and pressured WTI, which is priced in dollars. However, strong demand forecasts limited the decline in oil prices. The U.S. Energy Information Administration (EIA) slightly raised its forecast for oil demand growth in 2024, and OPEC maintained a relatively strong growth forecast of 2.2 million barrels per day.
From a technical perspective, on the 4-hour chart used to assess short-term trends, oil prices decisively broke through the downtrend channel, reaching the conservative breakout target of $78.17. Since breaking through this channel, oil may now be in a short-term uptrend, although it has reached the initial target and may easily pull back. The daily chart shows that the direction of oil is less clear. A key characteristic of the trend is the $79 resistance level from all three major simple moving averages: the 50-day ($79.52), 100-day ($79.21), and 200-day ($79.22). This may pose a significant obstacle to further increases in oil prices and could become a turning point. Therefore, a daily closing price above $80.36 (May 29 high) is needed to confirm a successful breakout of the resistance from the three major simple moving averages and continue rising to the target price of $82.56 (23.6% Fibonacci retracement level from $67.94 to $87.08). On the downside, support can be considered at $77.51 (50.0% Fibonacci retracement level), with a break lower continuing to test $76.42 (10-day moving average) and the $75.25 area (61.8% Fibonacci retracement level).
Today, consider going long on crude oil around $80.00, with a stop loss at $79.70 and targets at $81.00 and $81.20.

Spot Gold
Gold prices struggled to extend Friday's gains, falling below $2,320 to $2,310 on Monday. The benchmark 10-year U.S. Treasury yield rebounded above 4.25% after last week's decline, making it difficult for gold prices to gain traction. In early Asian trading on Monday, gold prices remained weak, hovering around $2,325. The median forecast by Federal Reserve officials indicates one rate cut this year, with market speculation that U.S. interest rates will remain higher for a longer period, causing the dollar to strengthen across the board. However, risk aversion triggered by uncertainty in European politics may drive safe-haven inflows, limiting gold's downside.
Last week, hawkish comments from Federal Reserve officials put pressure on gold, a zero-yield asset, as this made gold more expensive for overseas buyers. On the other hand, concerns over political issues in the Eurozone may limit gold's downside. French President Emmanuel Macron called for early parliamentary elections after losing to the right-wing nationalist party in European elections. Any negative developments surrounding Eurozone or French politics could provide some support for safe-haven assets like gold.
From a technical perspective, the bearish "head and shoulders" pattern suggests a neutral to downward bias, indicating that further declines are possible. Although momentum shows signs of buyer recovery, the technical indicator 14-day Relative Strength Index (RSI) remains bearish, indicating that the upward trend might be short-lived and paving the way for further declines. If gold prices continue to rise and break through $2,345 (50-day simple moving average) and $2,352 (65-week simple moving average), they could challenge the June 7 cycle high of $2,387 and prepare to test $2,400. Conversely, if gold prices fall below $2,316.50 (65-day simple moving average) and $2,300 (psychological threshold), the first support level will be $2,290 (neckline of the head and shoulders pattern), followed by the May 3 low of $2,277.
Today, consider going long on gold around $2,315, with a stop loss at $2,310 and targets at $2,330 and $2,335.

AUDUSD
Due to the loss of momentum in the USD later on, and ahead of a key interest rate decision by the Reserve Bank of Australia (RBA), AUD/USD successfully reversed its initial decline to around 0.6585 and subsequently rebounded above 0.6600. In early Asian trading on Monday, with the USD consolidating, AUD/USD ended its two-day losing streak, trading near 0.6615. Investors will closely watch the RBA's rate decision on Tuesday, with expectations that the RBA will keep rates unchanged. Given that inflation expectations remain above the Federal Reserve's 2% target, traders anticipate that rates will stay elevated for longer than expected, which has kept the USD strong following these data releases. For the AUD, due to rising inflation, RBA Governor Philip Lowe has emphasized the need to gain confidence that inflation will sustainably return to the 2%-3% target, and the board is not ruling out any possibilities. The RBA is expected to maintain a slightly hawkish stance of holding rates steady, which could boost the AUD and limit the downside for AUD/USD.
The daily chart shows that the technical indicator 14-day Relative Strength Index (RSI) is currently below 50 and trending downwards, indicating negative momentum. Meanwhile, the Moving Average Convergence Divergence (MACD) displays stable rising red bars, suggesting ongoing selling pressure. As the pair broke below the 20-day simple moving average (0.6633) to 0.6585 (yesterday's low), it indicates weakened buying momentum and a short-term negative outlook. If this trend continues, the 100-day (0.6564) and 200-day (0.6543) simple moving averages may become potential obstacles around the 0.6560 area. On the upside, a decisive break above 0.6680 would indicate that the pair could extend to the conservative target of 0.6714 and potentially reach the level of 0.6747 (January 5 high).
Today, consider going long on AUD around 0.6600, with a stop loss at 0.6580 and targets at 0.6645 and 0.6655.

GBPUSD
In the latter half of Monday, GBP/USD continued to trade weakly around 1.2700. Hawkish expectations from the Federal Reserve and a weak risk tone kept the USD stable, applying downward pressure on the pair. The next focus will be on the Federal Reserve's commentary. GBP/USD struggled to rebound slightly from around 1.2660, or nearly a one-month low, on Friday and fluctuated narrowly on the first trading day of the new week. The spot price currently seems to be accepted below the 1.2700 psychological level and may decline further amid bullish sentiment around the USD. In fact, the USD Index, which tracks the greenback against a basket of currencies, has remained high, close to its highest level since early May, touched last Friday after the Federal Reserve's unexpectedly hawkish stance, confirming the negative outlook for GBP/USD.
From a technical perspective, GBP/USD has shifted from neutral to bearish, with momentum suggesting that sellers are gaining strength. The 14-day Relative Strength Index (RSI) has dropped below 50, turning bearish, and the price action indicates that the pair has hit a new four-week low at 1.2656, opening the door for further declines. If GBP/USD breaks below the confluence of the 100-day moving average and the May 3 swing high, turning to support around 1.2643/38, it could accelerate the downtrend, exposing the 50-day moving average at 1.2612, ahead of 1.2600. Conversely, if buyers step in and reclaim 1.2700, GBP/USD could consolidate around 1.2700-1.2750, with resistance ahead at 1.2800 (psychological barrier) and 1.2850 (midline of the ascending channel).
Today, consider going long on GBP around 1.2688, with a stop loss at 1.2670 and targets at 1.2740 and 1.2750.

USDJPY:
USD/JPY has risen to a seven-week high near 158.00, driven by multiple positive factors. The USD strengthened due to the Federal Reserve maintaining its hawkish rate guidance. Meanwhile, the JPY weakened as the Bank of Japan (BOJ) pushed forward with plans to reduce bond purchases. In early Asian trading on Monday, USD/JPY continued its upward trend, reaching around 157.50. The Federal Reserve's hawkish stance provided some support for the pair. Simultaneously, the JPY fell as the BOJ decided to keep rates at 0% at the end of its June policy meeting on Friday. As widely expected, the Federal Reserve kept rates stable in the current range of 5.25% to 5.5% at its latest policy meeting last week and lowered the rate cut expectation for 2024 to once. On Sunday, Minneapolis Fed President Neel Kashkari indicated that it is a "reasonable forecast" for the Fed to wait until December to cut rates, adding that the Fed is in a very favorable position.
From a fundamental perspective, the BOJ maintains a loose policy, keeping the JPY weak. Technically, the daily chart shows USD/JPY broke above 157.00 (midline of the ascending channel) last week to a more than one-month high of 108.25 and remained above 105.71 (May 29 high) yesterday. The 14-day Relative Strength Index (RSI) is above the 50 level at 59.20, indicating upward momentum. Currently, significant resistance is around 158.00 - 158.25; if breached, USD/JPY could rise to the 34-year high of 160.20. Strong support below remains at 1156.72 (20-day moving average) and 156.10 (an upward extending trend line from the March 11 low of 146.48). Breaking below this level could intensify the downward pressure on USD/JPY, potentially pushing it towards the retracement support area around 155.50 (lower boundary of the ascending channel).
Today, consider shorting USD around 157.95, with a stop loss at 158.20 and targets at 157.20 and 157.00.

EURUSD
Due to the renewed weakness in the USD and expectations of Federal Reserve rate cuts, EUR/USD has regained buying interest and climbed back above the 1.0700 mark. Last week, EUR/USD further declined to a low of 1.0667 before rebounding to just above 1.07 in early Asian trading on Monday. In the latest European Parliament elections, voter sentiment across Europe shifted broadly toward center-right parties, leading to a temporary election in France and putting political pressure on the euro. In the U.S., the University of Michigan consumer sentiment index fell short of expectations, adding to negative data and reigniting market concerns about a recession. ECB officials have been trying to calm the markets as the euro underperformed against other major currencies this week. French President Emmanuel Macron dissolved the French government and called for emergency elections. Macron's approval rating is dropping due to public dissatisfaction with unpopular fiscal policies. Financial markets are worried about political instability in France, as Le Pen's proposals for tax cuts and lowering the retirement age could strain the EU economy.
EUR/USD fell to a six-week low of 1.0667 before a mild recovery, closing slightly above 1.0700 last week. The pair has been on a downward trend, declining from 1.0900 in June. The daily chart shows EUR/USD below the psychological resistance of 1.0800 and 1.0758 (50.0% Fibonacci retracement from 1.0601 to 1.0916) and falling towards the 1.0668 region (78.6% Fibonacci retracement from 1.0601 to 1.0916). A break below this level would clarify the trend towards the April low near 1.0601. On the upside, if EUR/USD manages to stabilize above 1.0700 (psychological level), it could allow the pair to rebound higher. In this scenario, 1.0758 (50.0% Fibonacci retracement) might be seen as the next resistance before 1.0800 (psychological barrier) - 1.0820 (250-day moving average).
Today, consider going long on EUR around 1.0720, with a stop loss at 1.0700 and targets at 1.0765 and 1.0770.

Disclaimer: The information contained herein (1) is proprietary to BCR and/or its content providers; (2) may not be copied or distributed; (3) is not warranted to be accurate, complete or timely; and, (4) does not constitute advice or a recommendation by BCR or its content providers in respect of the investment in financial instruments. Neither BCR or its content providers are responsible for any damages or losses arising from any use of this information. Past performance is no guarantee of future results.


