
US Dollar Index
After the highly anticipated release of the US Core Personal Consumption Expenditure data, the dollar saw little movement as all figures met market expectations. Month-end and quarter-end rebalancing flows might shift currencies over the weekend. Attention now turns to next week, with the US monthly employment report (Friday, July 5th) set to dominate. US markets are closed on Thursday for the July 4th holiday, so this week's non-farm payroll data might not receive the usual attention as traders extend their Independence Day break. The dollar index hit a new eight-week high of 106.13 earlier last week. Since the end of last year, the dollar index has been making higher lows and higher highs. If this trend continues, it will soon test the double peaks from mid-April and early May. Over the next three months, the dollar is expected to weaken, but this process may be volatile due to the Fed's strong inflation outlook, with a target of 2% only likely to be met by 2026.
The daily chart shows that the dollar index may move downward in the coming days this week. The Japanese Ministry of Finance has reiterated the emergency status of the exchange rate and may intervene at any time. This suggests significant movements could occur, leading to a temporary decline in the dollar. On the downside, 105.62 (23.6% Fibonacci retracement from 103.99 to 106.13) is the first support level before the simple moving average trio. First is the 55-day moving average at 105.25, guarding the 105.00 round number. The 100-day and 200-day moving averages are below at around 104.70 and 104.49, forming a double layer of protection to support any drop. If this area is breached, look to 104.00 (psychological market level) to support the situation. On the upside, the 20-day and 50-day moving averages formed a bullish "golden cross" pattern last week, with the biggest challenge being the 106.00 round number, followed by 106.13 (last week's high). A breakout would target the double top formed in April and May at the 106.50 - 106.51 level. To push the index to 107.11 (the highest level since November 2023), the bulls would need support from unexpected US inflation rises or further hawkish pushes.
Today, consider shorting the dollar index near 106.00, with a stop loss at 106.10, and targets at 105.60 and 105.50.

WTI Spot Crude Oil
Before the end of last week, WTI crude oil reached an eight-week high of $82.95. Oil prices are set to rise for the third consecutive week due to strong speculation that the Federal Reserve will start cutting interest rates from its September meeting. Traders see a 64% chance of the central bank lowering rates from current levels at the September meeting. There will be two rate cuts this year, not the one predicted by Fed officials in the latest dot plot, and weak inflation data will bolster expectations of early rate cuts by the Fed. This scenario will improve the overall demand outlook, benefiting oil prices. On the geopolitical front, the risk of escalating tensions in the Middle East has also contributed to the rise in oil prices. Israeli Defense Minister Yoav Gallant warned that Lebanon would face devastation if Hezbollah initiates a war. A war spreading from Gaza to Lebanon would cause supply chain disruptions. Considering the geopolitical risks, there might not be unexpected changes in the second half of 2024 due to concerns over demand and the prospect of increased supply from major oil-producing countries. Another important data point to note is that, according to the US Commodity Futures Trading Commission (CFTC), speculative net long positions in WTI crude oil futures increased by 53,339 contracts to 213,177 contracts in the week ending June 25.
The daily chart shows that despite the fundamentally bullish background, oil prices have recently broken above the technically significant 100-day ($79.43) and 50-day ($79.25) simple moving averages. This indicates that the path of least resistance for crude oil prices is upward. Therefore, any significant declines are more likely to attract new buyers but remain limited. Bulls are now looking to retest $82.56 (23.6% Fibonacci retracement from $67.94 to $87.08), with a breakout challenging $84.14 (April 26 high). At this stage, the key support area is the specific $79 level, derived from all three major simple moving averages: 50-day ($79.25); 100-day ($79.44); and 200-day ($79.11). This could pose a considerable obstacle to further price declines and may act as a turning point for oil prices. A daily close below $78.00 (round number) and $78.33 (38.2% Fibonacci retracement from $72.62 to $81.86) is needed to confirm a successful breach of the resistance posed by these three simple moving averages and to continue the decline towards the target level of $76.15 (61.8% Fibonacci retracement).
Today, consider shorting crude oil near $81.30, with a stop loss at $81.60, and targets at $80.20 and $80.00.

Spot Gold
Before the end of last week, spot gold prices surged to a high of $2,339.80 per ounce following the release of the US PCE inflation data. Gold ended June with a slight decline of about 0.02%, but it has risen over 12.78% since the same period in 2024. Gold investors might be looking for funds as gold remains in a holding pattern. Despite the neutral price action, the market seems to maintain an optimistic outlook because long-term fundamentals continue to support prices. Gold continues to trade within a relatively narrow range, with key support at $2,300 per ounce and initial resistance at $2,350. Inflation is not going away, geopolitical tensions are not easing, and government deficits are growing, providing strong support for gold. After two months of consolidation, the gold price action seems poised for a breakout, especially as inflation pressures appear to be easing further.
On the daily chart, the technical indicator—the 14-day Relative Strength Index (RSI)—is hovering around 49.50, indicating a lack of directional momentum. Despite gold holding above $2,319.20 (last Friday's low) and $2,300.00 (psychological level), it has yet to break above the 50-day simple moving average, which is currently near $2,337.60. If gold/USD breaks above this level and confirms it as support, technical buying could take place and sustain the upward movement. In this scenario, the next resistance levels could be at $2,368.70 (two-week high), and $2,387.80 (June 7 high), before reaching $2,400.00 (psychological level, static level). On the downside, initial support is at $2,319.20 (last Friday's low), and if the $2,300 support level is breached, it could drop towards $2,284.20 (38.2% Fibonacci retracement from $2,016 to $2,450), and $2,285.20 (area around the 89-day moving average).
Today, consider going long on gold near $2,322.00, with a stop loss at $2,318.00, and targets at $2,340.00 and $2,345.00.

AUDUSD
Following the release of the weak Personal Consumption Expenditure (PCE) Price Index report for May by the US Bureau of Economic Analysis (BEA), the AUD/USD pair rebounded from its intraday decline and climbed near the 0.6685 high. The report indicated that core inflation data increased by 0.1% month-over-month, lower than the previously released 0.2% and in line with expectations. Additionally, the annual core PCE inflation estimate decreased from 2.8% in April to 2.6%. The anticipated decline in US inflation data is expected to fuel expectations of an earlier rate cut by the Federal Reserve, which is unfavorable for the dollar. The Dollar Index turned negative and fell to 105.80. The central bank sees the September meeting as the earliest opportunity to shift towards policy normalization. The Fed is expected to cut rates twice this year, contrary to market expectations of just one rate cut predicted by Fed officials. Following the release of US inflation data, San Francisco Fed President Daly stated in an interview with CNBC that the weak PCE data is good news, but more positive data is needed to build confidence that inflation will drop to 2%.
On the Australian side, expectations of further rate hikes by the Reserve Bank of Australia (RBA) boosted the Australian dollar. Market speculation on RBA rate hikes intensified following the hotter-than-expected monthly Consumer Price Index (CPI) data. Inflation data rose by 4.0%, higher than the expected 3.8% and the previously released 3.6%.
Observing recent trends, the Australian dollar outperformed most other G10 currencies last week. Currently, the AUD/USD is trading near 0.6670. Daily chart analysis indicates that AUD/USD has been consolidating in a "horizontal channel" pattern for the past seven weeks, showing a neutral to stable situation. The 14-day Relative Strength Index (RSI) is at 55.60, indicating neutral to slightly bullish momentum. Further movements could suggest an upward trend direction. On the upside, last week's close showed a bullish "piercing line" pattern. At this stage, AUD/USD may face resistance near the upper boundary of the "horizontal channel" at 0.6705 and the psychological level of 0.6700. Further resistance is seen at the highest level since January at 0.6714, directly pointing to 0.6760 (January 4 high). On the downside, AUD/USD finds support near 0.6630 (midline of the horizontal channel), the 50-day moving average at 0.6615, and the trend line extending from the May 1 low of 0.6540 at 0.6625. A break below this level could lead the pair to test the lower boundary of the "horizontal channel" around 0.6575 and the 200-day moving average at 0.6554.
Today, consider going long on AUD near 0.6650, with a stop loss at 0.6635, and targets at 0.6705 and 0.6720.

GBPUSD
The GBP/USD pair struggles to maintain its bullish momentum as US data showed that the annual core PCE inflation rate dropped to 2.6% in May, limiting the dollar's upside and helping the pair hold its ground. Midweek, Fed Governor Michelle Bowman reiterated that the central bank is not yet at a point to consider rate cuts. She warned of further hikes if the disinflation process appears to stall or reverse. The Dollar Index, which tracks the greenback against six major currencies, briefly rose above 106. Meanwhile, the GBP/USD rate fell to a one-and-a-half-month low of 1.2612. Before the end of last week, the anticipated decline in the US core Personal Consumption Expenditure (PCE) Price Index for May led to a slight rebound in the pair. Core PCE inflation, the Fed's preferred inflation gauge, dropped from 2.8% in April to 2.6%, in line with expectations. On a monthly basis, core inflation rose slightly by 0.1%, down from the previous 0.2%. The weak inflation data weighed on the dollar, supporting expectations of an earlier rate cut by the Fed.
The daily chart shows that GBP/USD is holding key support near 1.2600 (psychological barrier) and 1.2579 (50% Fibonacci retracement from 1.2299 to 1.2860). The 14-day Relative Strength Index (RSI) oscillates around 44.50, indicating a potential consolidation ahead. Meanwhile, the 100-day (1.2642) and 50-day (1.2646) simple moving averages converge around 1.2640, forming a critical pivot level. If GBP/USD confirms this level as resistance, technical sellers may take action, opening the door to a decline towards 1.2600 (psychological level), 1.2570 (descending wedge), and 1.2560 (200-day moving average). A break below this level would target 1.2513 (61.8% Fibonacci retracement). On the upside, if GBP/USD starts using 1.2642 - 1.2647 as support, then 1.2700 (round number) and 1.2727 (23.6% Fibonacci retracement) will become key resistance levels before reaching 1.2800 (psychological barrier).
Today, consider going long on GBP near 1.2630, with a stop loss at 1.2610, and targets at 1.2680 and 1.2690.

USDJPY
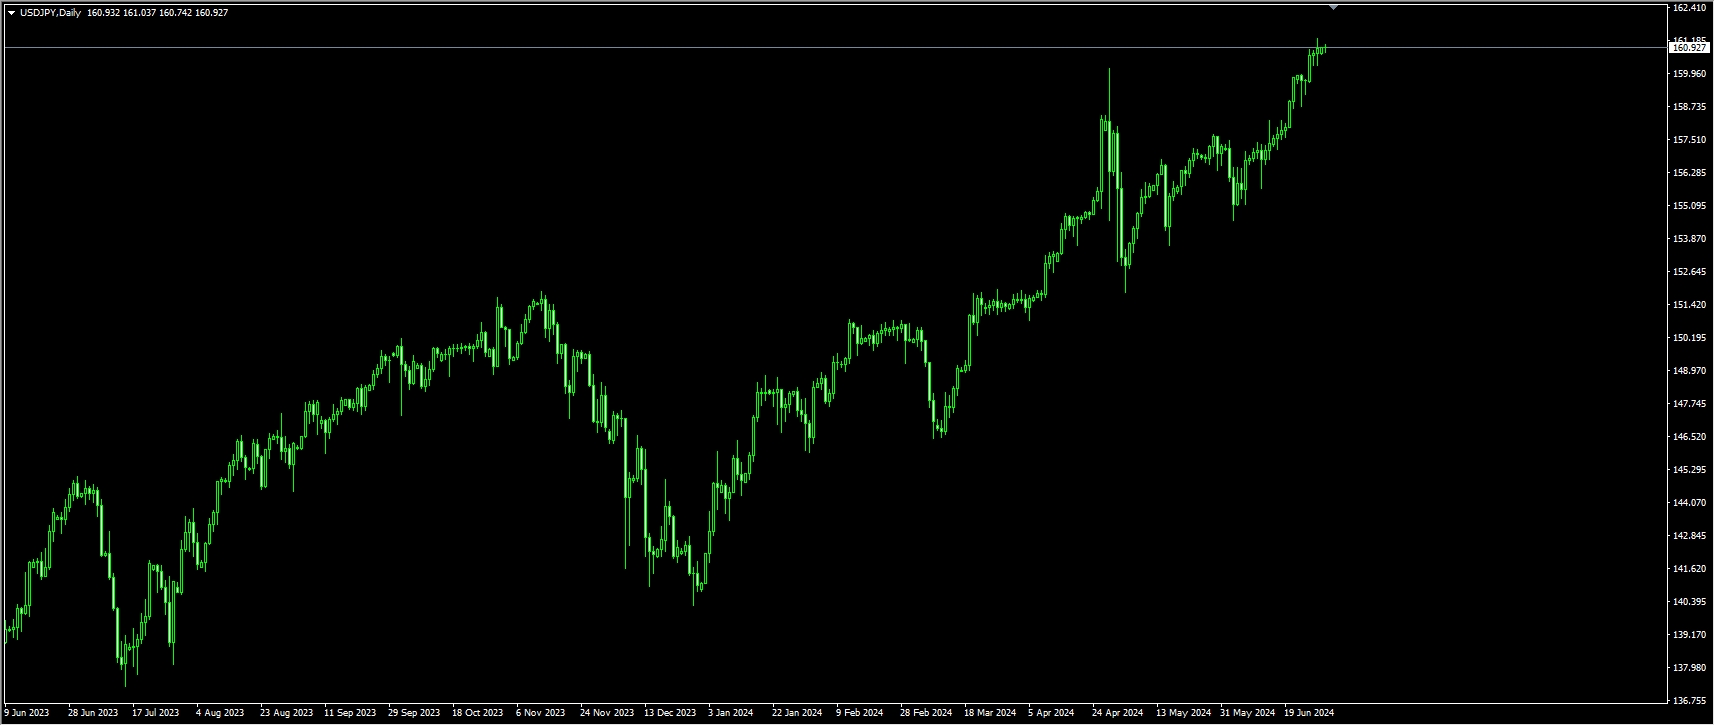
Despite increasing speculation that the US Federal Reserve may cut rates in 2024, US economic data spurred US Treasury prices higher, leading USD/JPY to extend its rally on Friday, with the yen hitting new historical lows. Last Friday, it briefly touched a 34-year high of 161.28 before pulling back slightly below 161.00. This move came as Japan's Finance Minister Shunichi Suzuki reiterated the same message from last week that the Japanese Cabinet is "watching the forex moves with a high sense of urgency," but this message has now lost its impact, and the market has acted regardless of the department's requests. Meanwhile, the Dollar Index, which measures the value of the dollar against a basket of six major currencies, remained in positive territory supported by this action. Even though US data late last week did not boost the dollar significantly, with durable goods prices flat and pending home sales shrinking for the second month in a row, personal consumption expenditure figures followed their deflationary trajectory without causing major volatility. USD/JPY faces the misfortune of closing lower for the third consecutive week.
The daily chart shows that USD/JPY recently hit new multi-decade highs. The pair has remained steadily above the 200-day moving average (which was at 143.18 at the start of the year) since early January. Additionally, the 14-day Relative Strength Index (RSI) is around the 51 level, indicating that upward momentum is sustained, confirming a bullish price signal. Although the pair is in overbought territory on the daily chart, a correction may still take a few days. At this stage, the upward trend for USD/JPY remains intact, with upward targets at 161.72 (upper boundary of the ascending channel) and 162.17 (123.6% Fibonacci extension from 160.20 to 151.85) levels. Ultimately, the high of 164.87 from November 1986 is in sight. However, traders remain cautious after reclaiming the 160.00 psychological level, viewed as the first line of defense for Japanese authorities to intervene in the forex market. Nevertheless, the pair continues to climb steadily, increasing the risk of intervention. Conversely, if USD/JPY falls below 160.00, the first support will be the pivot line at 159.40 (a support line extending from the May 2 low of 153.08), followed by 158.41 (78.6% Fibonacci retracement level). Once these levels are cleared, the next support level will directly point to 157.95 (20-day moving average).
Today, consider going long on USD near 160.60, with a stop loss at 160.25, and targets at 161.20 and 161.40.
EURUSD
Before the weekend, EUR/USD dropped near the critical support level of 1.0700. Continued political tension in France suggests that investors are bracing for the outcome of the first round of the French parliamentary elections on Sunday. The market is questioning whether the Le Pen government will address the French bond market and begin abandoning some seemingly unfunded tax cut plans. It is too early for the new government to significantly downplay its pre-election promises, and the road into September is likely to be challenging. On the other hand, increased ECB scaling down has kept EUR/USD low. Market fears that if the far-right National Rally in France succeeds, it could lead to EU tax cuts and protectionist spending plans, which would add political risk premiums and pressure the euro. Beyond these political influences, the narrowing ECB and Fed interest rate differential also limits the euro's upside potential. Specifically, following March, the Swiss National Bank announced a one-notch rate cut to 1.25% on June 20. The Swiss National Bank stated that current inflation pressures are rising, and moderate economic growth is expected in the coming quarters, contrasting with the global central banks' concerns over easing policies.
EUR/USD traded within the range of 1.0760 to 1.0660 last week. The daily chart shows that the pair is operating within a "descending triangle" pattern. Last week's close formed a bearish "death cross" pattern between the 20-day (1.0761) and 50-day (1.0774) moving averages. If EUR/USD breaks below the key support area formed by 1.0680 (an upward trend line from the April 16 low of 1.0601), 1.0668 (78.6% Fibonacci retracement from 1.0601 to 1.0916), and 1.0660 (descending triangle support line), a decisive break at these levels would initiate a new downtrend towards 1.0601 (April 16 low) and 1.0600 (psychological barrier). Additionally, the important support area is between 1.0660 and 1.0680. As long as this level holds, the euro may have a chance to rebound, but it would need to break clearly above 1.0746 (last week's high) to sustain an upward movement towards the 1.0800 (psychological level).
Today, consider going long on the euro near 1.0695, with a stop loss at 1.0680, and targets at 1.0750 and 1.0760.

Disclaimer: The information contained herein (1) is proprietary to BCR and/or its content providers; (2) may not be copied or distributed; (3) is not warranted to be accurate, complete or timely; and, (4) does not constitute advice or a recommendation by BCR or its content providers in respect of the investment in financial instruments. Neither BCR or its content providers are responsible for any damages or losses arising from any use of this information. Past performance is no guarantee of future results.


