
US Dollar Index
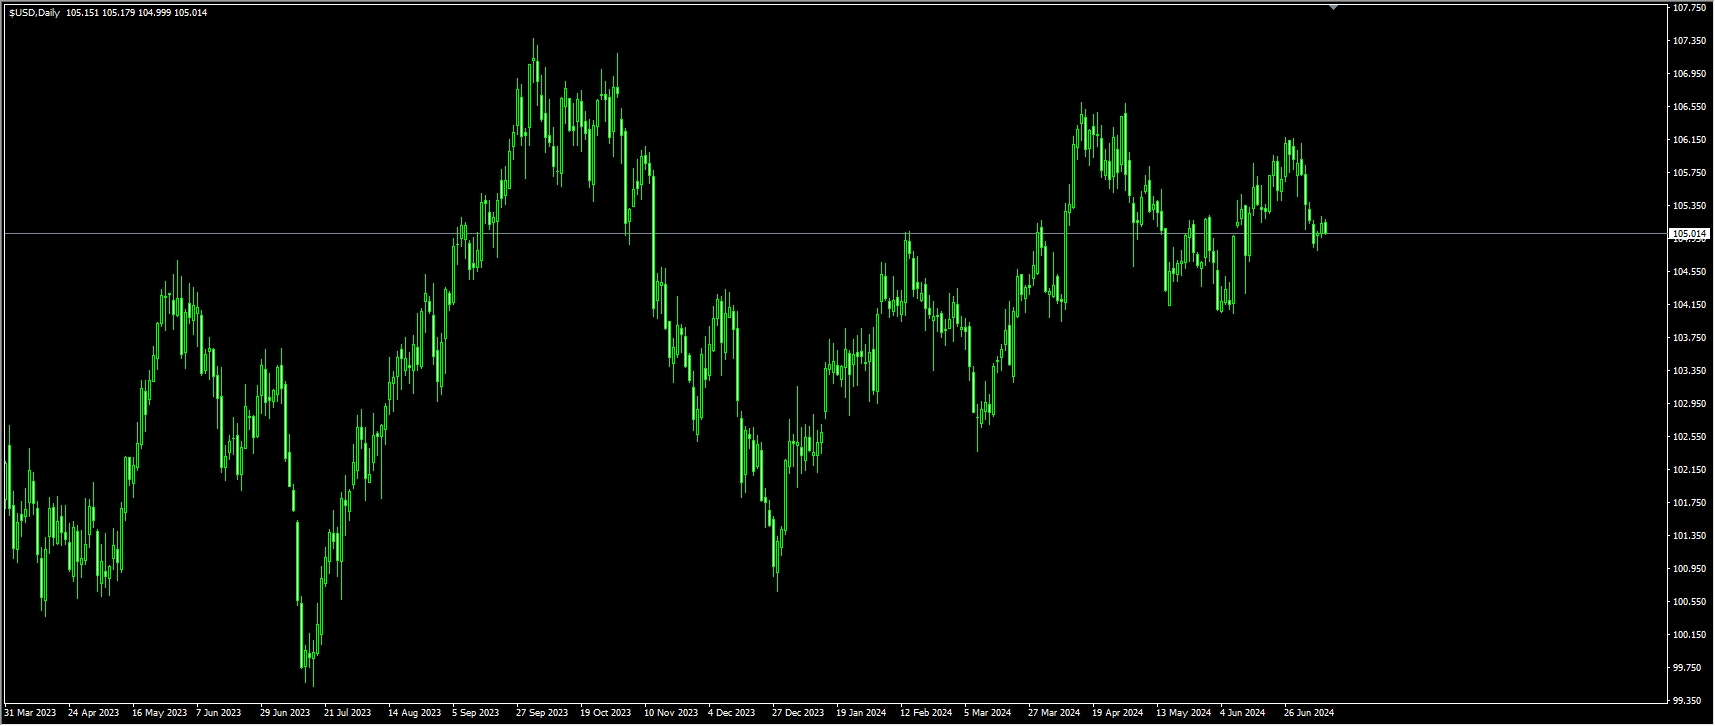
On Thursday, despite Powell's cautious stance during his visit to the House Financial Services Committee, the US Dollar Index experienced a slight decline, falling to 105.00. Powell's reluctance to cut interest rates immediately and his suggestion of continuous assessment based on data-driven metrics made the market uneasy. The dollar slightly rebounded, pushing the index above 105.00, thanks to Federal Reserve Chairman Jerome Powell's statements in Congress this week. His remarks avoided discussing a recent rate cut and instead advocated for patience. Coupled with anti-inflation metrics, the outlook for the US economy has raised hopes for a rate cut in September. That said, Federal Reserve officials are not in a hurry to implement cuts, opting to rely on data-centered metrics before making such decisions. The semi-annual monetary policy report submitted by Chairman Powell to Congress and his testimony before the Senate Banking Committee were the most notable events. He emphasized the importance of step-by-step policy decisions, acknowledging that while progress has been made toward achieving the 2% inflation target, recent data needs to be more encouraging to guarantee a rate cut. The US Consumer Price Index will be released on Thursday, and market participants will be closely watching.
Technically, although the US Dollar Index experienced a downturn, falling below the 20-day moving average of 105.55 and the psychological threshold of 105.00, its decline was limited by the 100-day moving average (104.79). It rebounded above 105.00, regaining some recovery. Technical indicators such as the 14-day Relative Strength Index (RSI) and the Moving Average Convergence Divergence (MACD) have retreated into negative territory but performed better, with midweek momentum strengthening. Nevertheless, the range represented by the 100-day moving average showed strong performance, repelling sellers and reestablishing support. On the downside, the 104.40 area (200-day moving average) could become strong support for further declines. As for the upside, attention can be given to the levels of 105.52 (23.6% Fibonacci retracement from 102.35 to 106.51) and the psychological barrier at 106.00.
Today, consider shorting the US Dollar Index around 105.10, with a stop loss at 105.20 and a target of 104.80 - 104.75.
WTI Crude Oil
On Wednesday, US WTI crude oil rebounded to $82.50 per barrel as the US crude oil market continued to struggle to find sustained bullish momentum. WTI crude oil had initially extended its recent decline, dropping below $81.00 per barrel, reflecting the ongoing challenge for the US crude market to secure a consistent bullish drive. The American Petroleum Institute (API) reported another week-on-week decrease in US crude oil inventories for the week ending July 5. Crude oil prices remained subdued on Tuesday. China's demand continues to fall short of the market's broad expectations for a rise in Asia's overall fossil fuel usage. The bullish momentum in crude oil was initially dependent on a rebound in demand from China at the beginning of the year, but so far, there have been no clear signs of an increase in Chinese demand. Tropical Storm Beryl, downgraded from a Category 1 hurricane to a Category 2, also failed to disrupt the US crude market as initially feared by barrel crude traders, halting the recent bullish momentum in WTI prices and keeping them at low levels.
From a technical perspective, WTI crude oil remains in a technical consolidation phase, retreating from last week's high of $84.65 to below the previous technical support level of $81.00, and falling below the 14-day moving average of $81.76 and the 20-day moving average of $81.13, indicating signs of weakening. If it loses the key psychological barrier of $80.00, the bears seem poised to push WTI prices down to the 200-day moving average of $78.49. Conversely, if the price can rebound above the $81.81 area (23.6% Fibonacci retracement from $72.62 to $84.65) and the $81.76 (14-day moving average), it will signal a renewed uptrend. The next target would be $82.80, with a breakout challenging the April 26 high of $84.50 and the recent double top formed near last Friday's high of $84.65.
Today, consider going long on crude oil around $82.30, with a stop loss at $82.00 and targets at $83.50 and $83.80.

Spot Gold
Amid renewed selling pressure on the US dollar, gold prices maintain a moderate positive value around $2,370 per ounce. In the Asian session on Wednesday, gold prices are poised to extend their previous rally above $2,350 as the dollar follows the US Treasury yields' corrective rebound. Gold traders weighed Federal Reserve Chairman Jerome Powell's testimony before the Senate Banking Committee on Tuesday. Despite Powell's cautious stance on the policy outlook, stating that inflation has been improving in recent months, he mentioned that "more good data will strengthen the case for a rate cut." Additionally, gold's rally stalled near $2,370 after Powell's testimony as US Treasury yields surged, boosting dollar buying. Market participants also took Powell's remarks as a reason to take profits on dollar shorts ahead of Thursday's key US Consumer Price Index (CPI) inflation release.
From a technical perspective, the 14-day Relative Strength Index (RSI) holding above the 55 level suggests a constructive short-term outlook for gold. Bulls need to break the six-week high of $2,393 to resume the uptrend towards the psychological barrier at $2,400. A breakout above this level could see a move to $2,432 (April 12 high) and potentially target the all-time high of $2,450. However, the market broadly perceives the short-term key resistance at $2,400 as a significant challenge for investors. On the downside, gold prices might find short-term support at the $2,350 psychological level. A break below this could challenge the area around the 50-day ($2,343.10) and 20-day ($2,338.80) simple moving averages. Sustained trading below this area might trigger a fresh downward move towards the $2,300 round figure.
Today, consider going long on gold at $2,367.00, with a stop loss at $2,363.00 and targets at $2,382.00 and $2,385.00.

AUDUSD
The AUD/USD pair saw a slight increase, maintaining a constructive stance above the key 0.6700 level ahead of Thursday's critical data release. The pair remains in a consolidation phase as the USD shows a clear rebound, influenced by Powell's cautious approach towards potential rate cuts by the Federal Reserve. Powell indicated that further evidence of inflation moving towards the target is required before taking any rate actions. Additionally, the AUD/USD's decline is exacerbated by the recent drop in copper and iron ore prices, which has intensified the Aussie’s losses earlier this week. In terms of monetary policy, the Reserve Bank of Australia (RBA), like the Federal Reserve, is expected to be among the last of the G10 central banks to start cutting rates. Overall, the RBA is not in a hurry to ease policy, with inflation expected to take some time to sustainably stay within the 2-3% target range. Furthermore, the potential easing by the Fed contrasts sharply with the RBA's likely prolonged restrictive stance, which could support the AUD/USD in the coming months. However, concerns over the slow momentum of China's economic growth could hinder the sustained recovery of the AUD, as China continues to face post-pandemic challenges.
Midweek, the AUD/USD exchange rate is around 0.6740. A daily chart analysis shows that the AUD/USD is consolidating within an upward channel, indicating a bullish inclination. Additionally, the 14-day Relative Strength Index (RSI) remains above 50, confirming the bullish trend. If the AUD/USD breaks above the 0.6761 (early week high) and 0.6775 (upper boundary of the upward channel) areas, the next target would be the psychological level of 0.6800. Further, it could aim for the December 2023 high of 0.6871. On the downside, the AUD/USD may find support near 0.6700, with additional support near the 50-day moving average at 0.6650. A break below this level could push the pair towards the retracement support at 0.6600.
Today, consider going long on the AUD/USD at 0.6732, with a stop loss at 0.6720 and targets at 0.6770 and 0.6775.

GBPUSD
As Powell testified before Congress for the second time, the lackluster decline in the US dollar seemed to support risk-related assets and encouraged GBP/USD to revisit its monthly high near 1.2840. Powell acknowledged some improvement in inflation data, but stated that it would be inappropriate to lower policy rates until the Fed is more confident that inflation is consistently moving towards 2%. Additionally, the market will focus on the US Consumer Price Index (CPI) data due on Thursday. On the UK side, Bank of England policymaker Jonathan Haskel suggested maintaining the current interest rate due to persistent price pressures in the employment market. With the focus shifting to upcoming economic indicators, the GBP’s performance against major currencies has been subdued. Specifically, investors are looking forward to the monthly UK GDP data and May’s industrial output figures, both set to be released on Thursday.
On the daily chart, the 14-day Relative Strength Index (RSI) remains above 60 after retreating from near 65 on Monday, indicating that the bullish bias for GBP/USD remains intact after a technical correction. On the upside, initial resistance can be seen at 1.2845 (early week high) and 1.2860 (key peak from June). A break above these levels would target 1.2893 (March 8 high) and the psychological barrier at 1.2900. Failure to hold above the supply zone at 1.2800 and 1.2815 would increase selling interest, with GBP sellers eyeing 1.2715, the 10-day moving average. If the decline continues, the next support would be at the 50-day moving average at 1.2684.
Today, consider going long on GBP/USD at 1.2830, with a stop loss at 1.2810 and targets at 1.2880 and 1.2890.

USDJPY
Ahead of Federal Reserve Chairman Jerome Powell's second testimony, the yen defended against the dollar's decline. Powell stated that it would be inappropriate to cut rates until the Fed is confident that inflation is approaching 2%. Meanwhile, the Bank of Japan is preparing to evaluate feasible strategies for reducing government bond purchases. USD/JPY rose for the second consecutive day, climbing above 161.00 points, as Powell remained cautious about rate cuts, despite acknowledging that the dual mandate risks of the US central bank are more balanced. The Bank of Japan's latest summary of market opinions highlighted the growing consensus among bond market participants on the need to reduce the central bank's bond purchase program. Although the BOJ currently purchases about 6 trillion yen worth of bonds monthly, market experts suggest a significant reduction to 2 to 4 trillion yen per month. Reducing the bond purchase program would increase Japanese interest rates, helping the central bank to begin tightening monetary policy. According to the latest money market forecasts, there is about a 60% chance that the BOJ will raise rates by 10 basis points at its July 31 meeting. If the BOJ holds steady, a rate hike is fully expected at the September 20 meeting, with another hike on December 19.
The daily chart shows a strong uptrend in USD/JPY, with the potential to break this year's high of 161.95. The 14-day Relative Strength Index (RSI) is bullish, indicating favorable momentum for buyers. Despite USD/JPY being in the overbought territory, the rising highs and lows suggest further upward movement. The formation of a "Doji" high-level consolidation pattern on Monday interrupted the consecutive decline, forming a bullish "Morning Star" pattern, suggesting a potential rise in USD/JPY. If USD/JPY breaks above 161.95 (last week's high), the next resistance level will be at 162.00 (psychological barrier). Further resistance is located at the 38-year high of 162.20, with a breakout potentially testing the November 1986 high of 164.87. Conversely, if bears intervene and push USD/JPY below the July 8 cycle low of 160.26, it would open the space for a drop below the 160.00 and 159.80 (midline of the upward channel) levels.
Today, consider going long on USD/JPY at 161.45, with a stop loss at 161.20 and targets at 162.00 and 162.10.

EURUSD
As investors digest Powell's testimony and turn their attention to the US inflation data released on Thursday, the EUR/USD pair has shrugged off consecutive daily pullbacks and managed to hold above the low of 1.0800. In his first semi-annual testimony before Congress, Powell reiterated that the Federal Reserve needs to see further progress towards its 2% inflation target before initiating rate cuts. However, he did not specify any timeline for potential rate cuts. Meanwhile, the European Central Bank (ECB) is considering further rate cuts after the summer, with the market expecting two more cuts by the end of the year. In contrast, while the Fed is currently projected to cut rates once in December, there is still debate among investors about whether the Fed will implement one or two rate cuts this year. The ECB's rate cut in June, combined with the Fed's decision to keep rates unchanged, highlights the policy divergence between the ECB and the Fed. This divergence could lead to further short-term weakness in the EUR/USD pair. However, the outlook for the Eurozone's economic recovery, coupled with some perceived weakness in key US fundamental economic data, could alleviate this divergence and occasionally support the EUR/USD in the near future.
The daily chart shows that if the EUR/USD continues to rebound, the first target will be the July high of 1.0845 and the weekly high of 1.0852 (June 12), followed by the June high of 1.0916 (June 4). A break above this level could target the psychological barrier at 1.1000. If the bears regain control, the EUR/USD could find support at the psychological level of 1.2800. A break below this level could test the 20-day moving average at 1.0749. A further drop could see the EUR/USD test the 1.0700 level (round number), ultimately falling to the 2024 low of 1.0601 (April 16). From a broader perspective, if the EUR/USD can hold above the key 200-day moving average (1.0801) as expected, it seems poised for further gains.
Today, consider going long on the EUR/USD at 1.0812, with a stop loss at 1.0800 and targets at 1.0860 and 1.0870.

Disclaimer: The information contained herein (1) is proprietary to BCR and/or its content providers; (2) may not be copied or distributed; (3) is not warranted to be accurate, complete or timely; and, (4) does not constitute advice or a recommendation by BCR or its content providers in respect of the investment in financial instruments. Neither BCR or its content providers are responsible for any damages or losses arising from any use of this information. Past performance is no guarantee of future results.


