
US Dollar Index
The US dollar traded higher at the start of the US trading session. European PMIs plunged in September, while US PMIs are currently unchanged. The US dollar index rose, trying to recapture 101.00. The pessimism surrounding the US dollar last week is estimated to have persisted and fermented this week, pushing the US dollar index to a new low of the market psychological mark of 100.00. Last week, the Federal Reserve unexpectedly cut interest rates by 50 basis points on Wednesday, breaking the expectations of a more conventional 25 basis point rate cut, thereby accelerating the decline of the US dollar. In addition, the recovery of risk sentiment due to the growing confidence in a soft landing of the US economy has exacerbated the weakness of the US dollar index. Following the unexpected rate cut in September, market participants may shift their attention to the assessment of the performance of the US economy in order to better gauge the possibility of further rate cuts. Looking back at last Wednesday's activities, it can be seen that the Federal Reserve cut interest rates for the first time since 2020, and the rate cut was larger than expected. In addition, the committee's forecasts indicate that interest rates may fall further before the end of the year.
From the daily chart, the US Dollar Index has only recorded gains in one of the past six weeks since it broke below the key 200-day simple moving average at 103.78. At this stage, the US Dollar Index has temporarily stabilized before the weekend's lows at the key support level of the "triple bottom" formed by the lows of 100.41 (20/9); 100.51 (27/8); and 100.57 (6/9/2023). Then the psychologically important point has gained some upward momentum, but the technical indicator 14-day relative strength index (RSI) is still weak (latest at 40.00) and close to oversold conditions, while the moving average convergence divergence (MACD) is printing decreasing green bars, which means that buying pressure is weak. These indicators show that the bears are in control and the index may continue to fall. The initial support level is estimated to be 100.41 - 100.57, and the next level will be 100.00 (market psychological level). On the other hand, if the US dollar index can reverse its disadvantage and return to the round mark of 101.00, it is not ruled out that it will further challenge the level of 101.47 (last Thursday's high).
Today, you can consider shorting the US dollar index around 101.00, stop loss: 101.10, target: 100.70, 100.60

WTI crude oil
Crude oil prices rose after the US Purchasing Managers Index led the gains. European PMI data showed that the region's service and manufacturing activities fell sharply. The US dollar index strengthened on Monday, and European investors turned to safe-haven currencies. In the early Asian session on Monday (September 23), international oil prices fluctuated narrowly, and US WTI crude oil was currently reported at around US$71.20 per barrel. Oil prices rose for the second consecutive week last week, thanks to the US interest rate cut and the decline in US supply. The market believes that the level below $70, coupled with the record low confidence of hedge funds in the rise of crude oil and fuel products prices, requires a recession to be justified, and the sharp interest rate cut in the United States this week will help reduce this risk. Oil prices rose more than 1% last Thursday, a day after the Federal Reserve slashed interest rates by 50 basis points. Rate cuts usually boost economic activity and energy demand, but some analysts are concerned about the weakness of the US labor market. Last week, US crude oil inventories fell to the lowest level in a year. Coupled with the escalation of geopolitical tensions in the Middle East, market concerns about reduced crude oil supply have heated up, continuing to provide more support for oil prices. Overall, the fundamental situation tends to support oil prices to continue to fluctuate higher in the future. September manufacturing PMI data from the United States and other Western countries will also be released this trading day, which investors need to pay close attention to.
WTI crude oil prices consolidated their recent gains last week. With tensions in the Middle East back in the spotlight and the US strategic reserves continuing to decline, it seems natural that oil prices will soar. On the upside, the first levels to watch are $72.10 {August 5 low}, and $72.08 {67.79 to 87.84 78.6% Fibonacci retracement}. $73.81 will be the next level to watch. Eventually, a return to $75.27 (Jan 12 high) is still possible, which could happen if the current fundamentals change dramatically. As for the downside, initial support remains at $70.00 (market psychological level), and a break below $69.00 (the central axis of the downward channel on the weekly chart). Once $69.00 is broken, it will re-point to $67.97 (Dec 8 low last year).
Consider going long on crude oil near 70.40 today, stop loss: 70.20; target: 71.60; 71.80

Spot gold
Gold continues to trend upward as the market continues to expect further rate cuts from the Federal Reserve. Such rate cuts will make gold, a non-yielding asset, more attractive. Growing tensions between Israel and Lebanon pushed gold to a new high of $2,635.00. In early Asian trading on Monday, gold prices retreated slightly and were near $2,600, but still close to all-time highs. The Federal Reserve's aggressive rate cuts and increased geopolitical tensions in the Middle East boosted the price of gold, a traditional safe-haven asset. The Federal Open Market Committee unexpectedly cut interest rates by 50 basis points after a two-day meeting last week and said more rate cuts could be introduced before the end of 2024. The Fed's rate cuts could increase the attractiveness of zero-yielding assets such as gold. In the Middle East, fears of escalating tensions in the Middle East after Hezbollah vowed to retaliate for a pager attack also provided some support to gold prices. This week, gold traders will be keeping a close eye on the geopolitical risk situation in the Middle East.
Gold prices continued to rise after hitting a new all-time high of $2,625.80. Although all technical and fundamental factors indicate an upward trend, the rally in gold seems overdone, opening the door for a pullback before aiming for a new all-time high. Momentum is in favor of buyers. The 14-day relative strength index (RSI) is in bullish territory (70.80) and not in overbought territory. Therefore, the path of least resistance is tilted upwards. The first resistance level for gold prices will be $2,650, followed by the psychological $2,700. In case of a pullback, the first support level will be the $2,600 mark, followed by the next key support area consisting of $2,588 (upward channel axis); $2,585 (Friday's low); and $2,584 (5-day simple moving average). If it breaks, the next target will be $2,561.40 (23.6% Fibonacci retracement from 2353.20 to 2625.80). As for the upper resistance, pay attention to $2,646 (upper track of the upward channel), exceeding this level will test the psychological price of $2,700.
Today, you can consider going long on gold before 2,624.00, stop loss: 2,620.00; target: 2,635.00; 2,640.00

AUD/USD
The Australian dollar continued to rise against the US dollar, and the highest exchange rate against the US dollar was 0.6854 yesterday. The Reserve Bank of Australia will announce its monetary policy decision early on Tuesday, and it is generally expected to keep the OCR unchanged again. In the early Asian session on Monday, AUD/USD traded near 0.6800, with a mild bullish trend. The weak Australian dollar weighed on AUD/USD. The Federal Reserve cut interest rates by 50 basis points last week to a range of 4.75% to 5.00%. This is likely to continue to weigh on the USD/AUD pair. On the AUD side, data released by Judo Bank and S&P Global on Monday showed that the preliminary reading of the Australian Judo Bank Manufacturing Purchasing Managers' Index fell to 46.7 in September from 48.5 in August. Meanwhile, the Services Purchasing Managers' Index (PMI) fell to 50.6 in September from 52.5 in the previous month, and the Composite Purchasing Managers' Index (PMI) fell to 49.8 in September from 51.7 in the previous month. The Australian dollar fell slightly under the direct impact of the decline in the Australian Purchasing Managers' Index. The Reserve Bank of Australia will announce its interest rate decision on Tuesday and is expected to keep the official cash rate (OCR) at 4.35%. RBA Governor Bullock will then hold a press conference.
From the daily chart, the AUD/USD indicator is flat around 0.6800, as buyers seem to lock in gains from last week's trading. As the pair approaches the yearly high (0.6840), it may trade sideways in the coming trading sessions before the next uptrend. Meanwhile, technical indicators remain positive, with the 14-day relative strength index (RSI) close to 64, indicating that the pair is still in an uptrend. The key to the upside this week is 0.6840 (this year's high), once it breaks above 0.6840, the upward target will be the high of 0.6871 in December last year, and further towards 0.6889 (180-week moving average), and 0.6899-06895 (double top high in June and July last year), and below it, it will target 0.6947 (76.4% Fibonacci rebound from 0.7157 to 0.6270). As for the downward pressure. If there is a pullback, the initial support area below is currently at 0.6748 (5-week moving average), and if it breaks, it will see 0.6713 (50.0% Fibonacci rebound level) and 0.6700 (round mark) areas.
Today, you can consider going long on the Australian dollar before 0.6820, stop loss: 0.6810; target: 0.6860; 0.6870.

GBP/USD
Despite the UK data being lower than expected, GBP/USD still cut its early losses and aimed to restore its bullish trend. Dovish Fed speakers and mixed US data put the dollar under selling pressure. In early Asian trading on Monday, GBP/USD fluctuated lower to 1.3270, temporarily ending its three-day winning streak. The mild recovery of the US dollar weighed on GBP/USD. The Federal Reserve cut its key overnight lending rate by 50 basis points last week, the first rate cut by the Federal Reserve since the epidemic. The Fed’s preferred inflation indicator, the US Personal Consumption Expenditure Index, will be released this Friday and may provide some hints on the situation of tackling inflation and the outlook for US interest rate policy. Meanwhile, the uncertain outlook for the US economy and rising expectations of a rate cut by the Fed later this year will continue to drag the dollar lower against the pound. On the other hand, Bank of England Governor Andrew Bailey said that “it is vital to keep inflation low” and to this end, “we need to be careful not to cut rates too quickly or too much”. The decision came a day after the UK Consumer Price Index inflation rate remained stable at 2.2% year-on-year in August.
From a technical perspective, GBP/USD is clashing with solid resistance levels as the pair reached a close test of the 1.3400 critical point and the 1.3411 (78.6% Fibonacci rebound from 1.4248 to 1.0339) resistance level. Since then, the pair has erased some of its gains and is about to form a “shooting star” pattern, opening the door for further declines. According to the 14-day relative strength index (RSI), the momentum remains bullish. However, a negative divergence is imminent, which could spur a pullback in the pair. If GBP/USD is unlucky enough to break below 1.3268 (Friday's low), and 1.3250, further declines are expected. Once cleared, the next stops will be 1.3200 (market psychological level), and 1.3203 (5-week simple moving average). If exceeded, key support will be exposed to the peak of 1.3142 on July 14, 2023.
Today's recommendation is to go long GBP before 1.3330, stop loss: 1.3310, target: 1.3400, 1.3411

USD/JPY
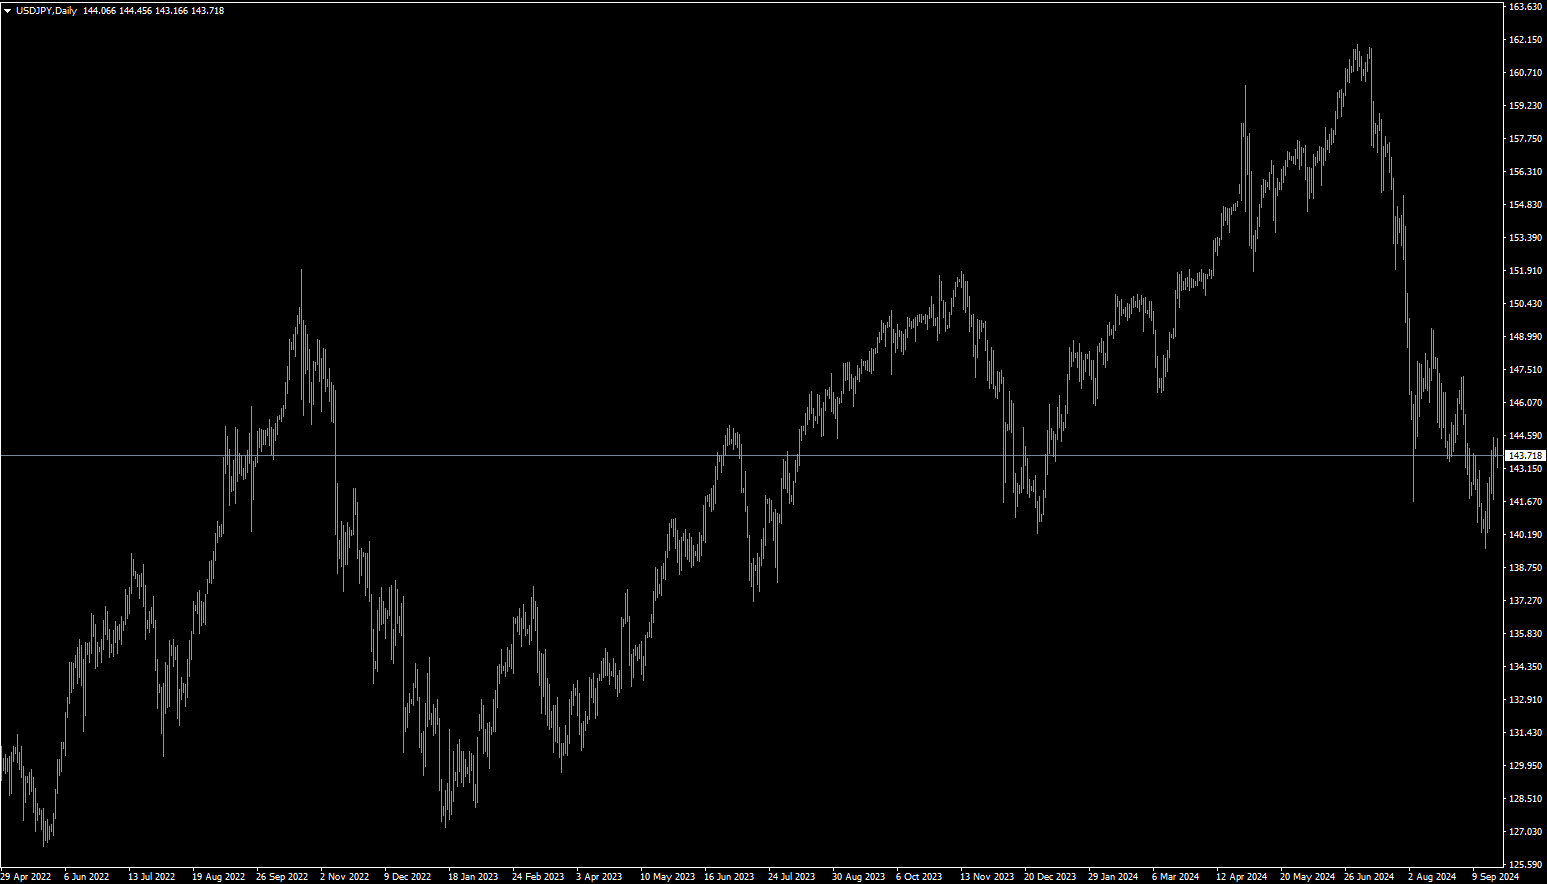
USD/JPY rose above 144.00 after the mixed preliminary data of the US S&P Global Purchasing Managers' Index (PMI) for September. It then retreated to 143.50. Investors await the Bank of Japan's speech on Tuesday. The yen extended its losses for the third consecutive trading day in holiday-light trading on Monday. Growing concerns that the Bank of Japan is not in a hurry to raise interest rates may have an impact on the yen's trend. The Bank of Japan maintained its interest rate target between 0.15-0.25% at its meeting last Friday. Bank of Japan Governor Kazuo Ueda stressed that the central bank "will continue to adjust the level of loose monetary policy as needed to achieve our economic and inflation goals. The dollar continued to rise as government bond yields regained lost ground. However, the dollar may face challenges as market expectations for further interest rate cuts by the Federal Reserve in 2024 continue to grow. In addition, Japan's new "top currency diplomat" Atsushi Mimura said in an interview with NHK that the yen carry trades accumulated in the past are likely to have been largely unwound. He added: "We have been monitoring the market to ensure that this does not happen." Analysis of the daily chart shows that USD/JPY traded around 144.00 at the beginning of the week, and the currency pair moved higher within a descending channel last week. If the pair breaks above the upper band of the channel early this week, the momentum will shift from bearish to bullish. Moreover, one of the technical indicators, the 14-day relative strength index (RSI), is slightly below the 50 level {now at 47}. A break above this critical level could signal the emergence of bullish sentiment. On the upside, the immediate resistance is strong near 144.86 (23.6% Fibonacci rebound from 161.95 to 139.58). This is followed by the area around 145.63 {10-week simple moving average}. On the downside, USD/JPY could test the 21-day exponential moving average at 143.46, followed by the round number at 143.00, and 143.12 (125-week SMA) levels.
Today, it is recommended to short the US dollar before 143.80, stop loss: 144.10; target: 142.80, 142.70
EUR/USD
The EUR/USD pair closed lower on Monday, trading just above the 1.1100 mark. Weak data related to European economic growth has fueled speculation that the European Central Bank will have to cut interest rates more than previously expected. The EUR/USD pair remained near the 1.1160 level during the Asian session on Monday. As the likelihood of further rate cuts from the Federal Reserve in 2024 rises, the U.S. dollar is likely to weaken, which could support the EUR/USD pair. On the euro front, ECB President Christine Lagarde stressed in her speech last Friday that monetary policy needs to remain adaptable in an evolving world. According to Euronews, while the core objectives of monetary policy, especially price stability, remain unchanged, central banks must remain flexible to respond to the challenges posed by a rapidly changing global economy. Traders are expected to keep a close eye on the Purchasing Managers' Index (PMI) data for the eurozone and Germany to be released later in the day. The monthly PMI is a leading indicator of business activity that provides signals on economic health and trends.
At the start of the week, the EUR/USD pair remained trading near the 1.1150 level. The near-term outlook for the pair remains positive as the 200-week SMA near 1.1051 is sloping upwards and meeting buyers to provide dynamic support. The major pair remains firm as it has regained confidence near the psychological support of 1.1100. The 14-day RSI, a technical indicator, retreated above 55.00. A sustained move above the above level would trigger a bullish momentum. On the upside, the circular resistance of 1.1200 would act as a major hurdle for the euro bulls. A break of this level would see the asset fall to the July 2023 high of 1.1275. On the downside, 1.1051 (200-week SMA), and the psychological level of 1.1000 would act as major support areas.
Today it is recommended to go long on USD before 1.1100, stop loss: 1.1085, target: 1.1150, 1.1160.

Disclaimer: The information contained herein (1) is proprietary to BCR and/or its content providers; (2) may not be copied or distributed; (3) is not warranted to be accurate, complete or timely; and, (4) does not constitute advice or a recommendation by BCR or its content providers in respect of the investment in financial instruments. Neither BCR or its content providers are responsible for any damages or losses arising from any use of this information. Past performance is no guarantee of future results.


