
US Dollar Index
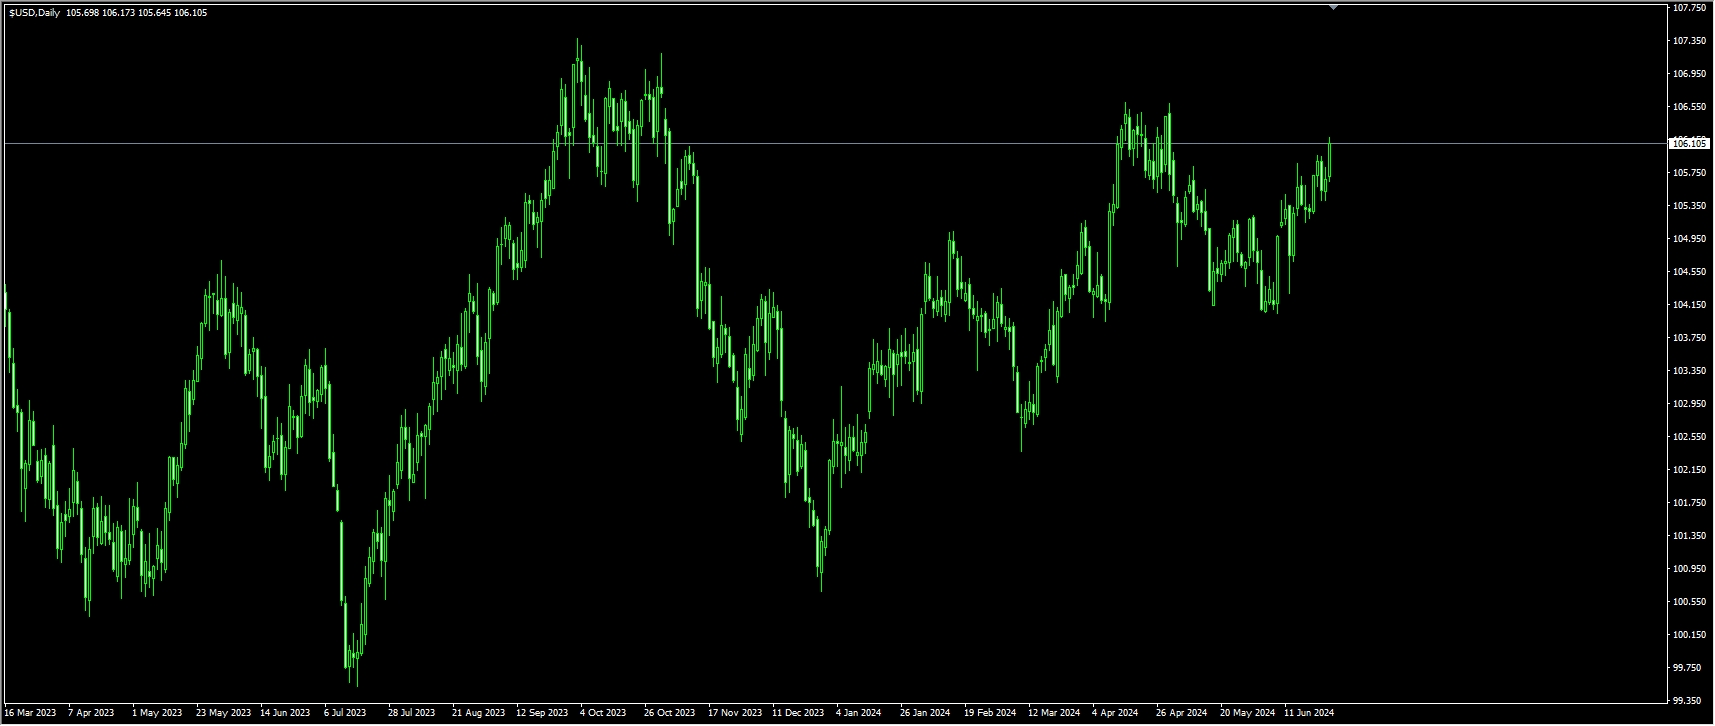
On Wednesday, the US Dollar, represented by the Dollar Index (DXY), climbed to 106.00, a level last seen in early May. The US economy continues to demonstrate resilience. Some deflationary signals are apparent but still present, preventing the Federal Reserve from fully embracing a loosening cycle. At the beginning of the week, the dollar briefly declined due to hawkish remarks from the Federal Reserve. Subsequently, after opening the week weak, the Dollar Index rose to around 105.80. The recovery in US Treasury yields seems to have ignored the slight dip in consumer confidence reported during the day. The US labor market is approaching a critical point, where further slowing of job openings could indicate a rise in unemployment. It might be time to consider whether the policy is putting excessive pressure on the economy. The focus this week is on the core PCE (Friday). The softer readings of core CPI and PPI in May have led the market to expect a softer core PCE. If the data is weaker than expected, hopes for a Fed rate cut will rise, which would also curb the dollar's rally, but hotter data could continue to fuel dollar momentum.
The daily chart shows that the Dollar Index maintains a mildly bullish momentum, with the 14-day Relative Strength Index (RSI) at 57.45, though it is trending downward. A pullback is not ruled out. Support levels are at 105.17 (50-day moving average), 105.00 (psychological level), and 104.80 (61.8% Fibonacci retracement from October high to 2024 low). A break below these levels would point to 104.47 (200-day moving average). Resistance levels are at 106.18 (April 24 high), with the next level to watch at 106.51 (April 16 high).
Today, consider shorting the Dollar Index near 106.10, with a stop loss at 106.20 and targets at 105.80 and 105.75.
WTI Spot Crude Oil:
Oil prices are trading sideways ahead of the US oil inventory data release. The US EIA is expected to show a second consecutive week of declining oil inventories. Investors are awaiting the US core Personal Consumption Expenditures (PCE) inflation data for new rate guidance. During the Asian session on Wednesday, WTI crude oil prices attracted new buyers, recovering some of the previous day's pullback from the $81.65 region, which is near a two-month high. Amid ongoing geopolitical tensions due to Israel's attack on Gaza and Ukraine's attack on a Russian refinery, WTI oil prices are currently trading around $81.50. Additionally, the risk of a full-scale war between Israel and Lebanon remains due to provocations from Hezbollah, exacerbating market concerns about supply disruptions from major oil producers. This is seen as a key factor influencing WTI oil prices, although worries about weak demand from the world's largest oil consumer might limit further price increases. Meanwhile, hawkish comments from influential Federal Reserve members and the unclear timeline for potential rate cuts by the Fed may also weigh on oil prices.
From a technical perspective, recent price action has halted the bullish momentum, keeping WTI crude oil prices at the lower end of the $81.50 supply zone. Intraday buying pressure is approaching Monday's low of $81.53 and the $81.00 level. If further declines occur, barrel prices may drop to $80.00 (psychological level) and the 200-day moving average at $78.99, with the next level to watch at $78.33 (38.2% Fibonacci retracement from $72.62 to $81.86). The daily chart has been mostly range-bound since the 12.65% rally from the early June low of $72.45. A short-term breakout above $82.12 (last Friday's high) would set the next upward targets at $83.50 and $84.14 (April 26 high).
Today, consider going long on crude oil around $80.85, with a stop loss at $80.60 and targets at $81.95 and $82.20.

Spot Gold
Gold prices continue to face bearish pressure, dropping below $2,300 on Wednesday for the first time in two weeks. Hawkish remarks from the Federal Reserve led to a strong rise in the benchmark 10-year US Treasury yield to around 4.3%, driving gold prices lower midweek. On Wednesday, gold prices against the USD (XAU/USD) experienced a second consecutive day of slight declines, hovering around a more than one-week low. Hawkish comments from several influential Federal Reserve officials overnight indicated that the central bank is unlikely to start a rate-cutting cycle soon due to the strong US economy. This supports a modest rise in US Treasury yields, boosts the dollar, and pressures the non-yielding gold. Meanwhile, weak May consumer and producer price indexes keep hopes for a Fed rate cut in September alive. Additionally, geopolitical tensions in the Middle East and the risk of further escalation in the Russia-Ukraine war provide some support for safe-haven gold, limiting its downside. Traders might prefer to wait for US data, including Thursday's final Q1 GDP reading and Friday's PCE price index release, which could influence the Fed's decision and provide new directional impetus for XAU/USD. Traders also seem reluctant to make aggressive directional bets, anticipating that Friday's PCE price index will provide significant momentum.
From a technical perspective, the recent failure of gold prices to break above the 50-day moving average at $2,341.20, followed by a decline, favors bearish traders. Additionally, oscillators on the daily chart have started to turn downward again, indicating that the path of least resistance for gold is to the downside. However, caution is advised before betting on further declines until prices consistently break below the short-term ascending trendline support around the $2,310 region. Subsequently, XAU/USD could further break below the psychological $2,300 barrier and retest the June swing low around the $2,287-$2,286 area. On the other hand, any meaningful upward movement currently seems to face strong resistance near the 50-day moving average, currently around $2,341.20, with additional resistance near last Friday's high around the $2,368-$2,369 region. If the price continues to strengthen, it might rise to intermediate resistance levels at $2,387-$2,388, eventually breaking the $2,400 round figure.
Today, consider going long on gold around $2,294.00, with a stop loss at $2,290.00 and targets at $2,310.00 and $2,315.00.

AUDUSD
Despite the strengthening of the US dollar and the narrative surrounding the Reserve Bank of Australia's (RBA) prolonged tightening, the AUD/USD pair managed to rebound from Tuesday's pullback, particularly in the context of still-high Australian inflation. Following recent remarks by RBA Assistant Governor Christopher Kent, who stated that recent data reinforced the need to remain vigilant about the upside risks to inflation and did not rule out the possibility of rate hikes, the Australian dollar showed little reaction and remained influenced by the fluctuations in the US dollar, which continued to be supported by hawkish comments from Federal Reserve officials. The May Westpac Leading Index for Australia rose from the previous value of -0.03% to 0%, while copper and iron ore prices saw slight declines but remained in consolidation ranges, exacerbating pessimism around the AUD. The potential divergence between the Fed's possible easing policies and the RBA's likely restrictive stance over the long term could support AUD/USD in the coming months. However, ongoing concerns about China's slow economic recovery post-COVID-19 could hinder the sustained recovery of the AUD/USD pair.
From a technical perspective, the 14-day Relative Strength Index (RSI) is above the 56 level, indicating the return of bullish momentum. If the bulls maintain control, AUD/USD could reach 0.6700 (psychological barrier), followed by the May high of 0.6714 (May 16), and then the January 4 high of 0.6760. On the other hand, bearish attempts could drive AUD/USD lower, first touching the 0.6600 (psychological level), and finding support around 0.6581 (38.2% Fibonacci retracement from 0.6362 to 0.6714). A deeper decline could lead AUD/USD to return to 0.6540 (220-day moving average) and 0.6500 (round figure).
Today, consider going long on AUD around 0.6632, with a stop loss at 0.6615 and targets at 0.6680 and 0.6690.

GBPUSD
GBP/USD remains in a vulnerable position, trading in the negative territory below 1.2650. The negative shift in risk sentiment has helped the US dollar outperform its competitors, preventing the pair from rebounding ahead of mid-tier US data releases. The GBP/USD exchange rate has continued its sideways consolidation for the second consecutive day, remaining confined within a narrow range below the 1.2700 mark during the Asian session on Wednesday, necessitating a cautious approach. Earlier this month, the Federal Reserve's unexpectedly hawkish stance provided justification for policymakers to maintain higher rates for a longer period. However, the market still anticipates a greater likelihood of the Fed beginning to cut rates in September, putting dollar bulls on the defensive and acting as a driving force for the GBP/USD pair. Nevertheless, the Bank of England's dovish pause last week has limited the upside potential for the pound and the pair ahead of the July 4th UK elections.
From the daily chart, GBP/USD continues to trend lower as recent price action has been capped near the 25-day moving average around 1.2727, presenting a short-term resistance level difficult for bulls to overcome. If the upward momentum continues to weaken, it could push GBP/USD closer to key support levels at 1.2639 (50-day simple moving average), followed by 1.2600 (psychological level), and 1.2556 (200-day simple moving average). Conversely, the 1.2700 level remains a technical congestion area for GBP/USD, with further trading expected around 1.2760 (last Monday's high) and above the 1.2800 psychological barrier.
Today, consider going long on GBP around 1.2600, with a stop loss at 1.2585 and targets at 1.2660 and 1.2670.

USD/JPY
The USD/JPY pair maintains its bullish momentum, trading above the 160.00 level for the first time since 1986, reaching up to 160.87. With the pair holding above 160.20, investors are becoming anxious. During the Asian session on Wednesday, USD/JPY oscillated within a narrow trading range. Meanwhile, the upside remains capped due to concerns that Japanese authorities or the Bank of Japan (BOJ) might intervene in the market to support the domestic currency. Indeed, Japanese Vice Finance Minister Masato Kanda reiterated that the government is prepared to take appropriate action if excessive currency fluctuations negatively impact the national economy. However, Kanda's comments had little effect on the yen due to the BOJ's reluctance to provide detailed plans for reducing bond purchases. This stands in stark contrast to the Federal Reserve's hawkish stance, indicating that the path of least resistance for the USD/JPY pair is upward.
The USD/JPY pair has been on an upward trend after breaking the 159.00 level, raising concerns about potential intervention by Japanese authorities or the BOJ in the forex market. Technical indicators show the 14-day Relative Strength Index (RSI) above the 72.00 level, indicating upward momentum. Momentum indicators favor buyers, but downside risks remain. If USD/JPY breaks the psychological level of 160.00 and this year's high of 160.20, the next resistance level to test will be 161.00, followed by 162.17. On the downside, if USD/JPY falls below the daily low of 158.75, it could pave the way for testing key support levels. The next support level is at the conversion line of 157.82, followed by 156.60 (an upward trend line extending from the March 11 low of 146.48).
Today, consider shorting USD around 161.10, with a stop loss at 161.35 and targets at 160.00 and 159.80.

EURUSD
Due to a significantly stronger US dollar and hawkish Federal Reserve comments, EUR/USD has further declined to around 1.0660, a multi-week low. On Wednesday, EUR/USD experienced consolidation around the 1.0700 mark as euro traders awaited meaningful data releases. Starting Thursday, the market will anticipate new data to drive market movements, resulting in thin momentum until then. The week’s data releases officially kick off on Thursday with the final June Eurozone Consumer Confidence Index and the revised Q1 US Gross Domestic Product (GDP) figure, expected to hold steady at 1.3%. On Friday, Germany's May retail sales data and the latest US PCE Price Index for May will be released, breaking the quiet economic data schedule for the week. As one of the Federal Reserve's preferred inflation indicators, investors will closely monitor the key US inflation data for continued signs of easing.
In recent price action, EUR/USD remains in consolidation, with the 200-hour exponential moving average from 1.0710 exerting pressure on intraday prices. However, the demand zone below 1.0650 provides technical support and sustains buying interest. The daily chart shows technical congestion, but as highs and lows continue to oscillate between lower highs and lower lows, EUR/USD is likely to continue its decline. EUR/USD is drifting below the 50-day moving average at 1.0772 and the 1.0800 level. If it fails to decisively recover to recent lower highs, EUR/USD might test the previous significant low of 1.0600. Before this, consider the 1.0668 and 1.0650 areas.
Today, consider going long on EUR around 1.0660, with a stop loss at 1.0645 and targets at 1.0730 and 1.0740.

Disclaimer: The information contained herein (1) is proprietary to BCR and/or its content providers; (2) may not be copied or distributed; (3) is not warranted to be accurate, complete or timely; and, (4) does not constitute advice or a recommendation by BCR or its content providers in respect of the investment in financial instruments. Neither BCR or its content providers are responsible for any damages or losses arising from any use of this information. Past performance is no guarantee of future results.


