
US Dollar Index
The US Dollar Index showed mixed performance on Thursday, testing lower following mixed US data, but found enough support to limit losses. Part of the mid-week rally was triggered by hawkish remarks from Federal Reserve Governor Michelle Bowman. Bowman warned, "We are not yet at a point where it would be appropriate to lower the policy rate," adding, "If progress on inflation stalls or reverses, I would be willing to raise the federal funds rate target range at future meetings." Meanwhile, Federal Reserve Governor Lisa Cook reminded market participants that with significant progress on inflation and a cooling labor market, it will be appropriate to lower the level of policy restriction at some point. The timing of any such adjustment will depend on economic data and its implications.
The cyclical uptrend of the dollar remains intact. Firstly, the Fed's policy continues to diverge from that of most other major central banks. Secondly, a favorable US macroeconomic backdrop provides reasons to anticipate further hikes in the federal funds rate. Thirdly, the composite PMI for June indicates strong momentum in US economic growth.
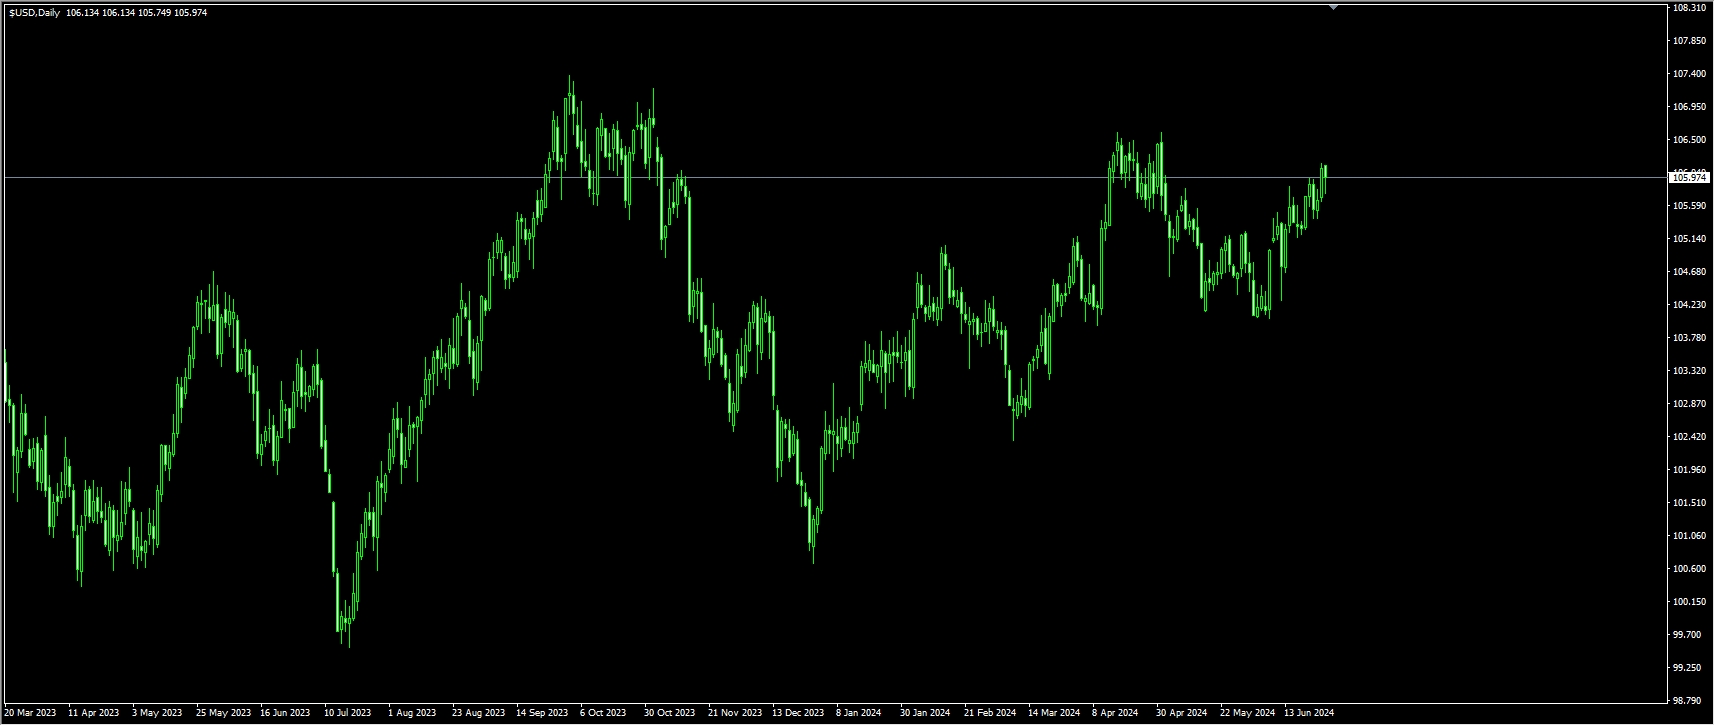
The technical outlook remains very bullish, with indicators firmly pointing upward. The 14-day Relative Strength Index (RSI) stays above the 60 level, and green bars are forming on the Moving Average Convergence Divergence (MACD), indicating gathering bullish strength. The gradual rise in these indicators suggests that the Dollar Index might be preparing for further gains. Additionally, the Dollar Index remains above the 20, 100, and 200-day Simple Moving Averages, confirming a continued optimistic outlook. As the index reaches its highest level since early May, and indicators show an inclination for further rises, the Dollar Index is expected to climb further to 106.51 (April 16 high). The next target for bulls is the 107.11 level (November 1 high last year). As for support levels, they are at 105.44 (14-day moving average), 105.00 (market psychological threshold), and 104.80 (61.8% Fibonacci retracement from October high to 2024 low).
Today, consider shorting the Dollar Index around 106.00, with a stop loss at 106.10, and targets at 105.70 and 105.65.
WTI Spot Crude Oil
WTI remains above $81.00 as the US core PCE inflation comes into focus. An unexpected increase in US oil inventories has exacerbated demand concerns. If Hezbollah starts a war, Israel is prepared to inflict significant damage on Lebanon. During Thursday's Asian session, WTI fell to around $80.80, further retreating from the two-month high of $82.17. Crude oil prices came under pressure after an unexpected rise in US crude inventories raised concerns about weakening demand in the world's largest oil consumer. Ongoing geopolitical tensions in the Middle East and Ukraine could further elevate oil prices. Meanwhile, last month, US crude oil imports surged to their highest level in nearly two years as refineries sourced heavy crude from Canada and Latin America to produce fuel for the summer driving season. According to shipping tracking service Kpler, US crude oil imports in May reached 3.1 million barrels per day, the highest level since July 2022. Reuters reported that imports remain strong this month, averaging around 2.9 million barrels per day.
WTI prices continue to trade within a broad range of $80.50 to $82.12 this week, with a substantial supply zone limiting upward momentum above $82.12 (last Friday’s high). The technical indicator, the 14-day Relative Strength Index (RSI), remains above the 60 level, indicating that bullish strength is gathering. If intraday prices break above the resistance area of $82.00 (round number) and $82.12 (last Friday's high), the next target is the $84.14 (April 26 high) mark. Currently, WTI crude prices are consolidating around $81.50, and continued consolidation paves the way for a bearish turn towards $80.00 (market psychological level) and $79.46 (200-day moving average). A downward push would risk further declines to $78.33 (38.2% Fibonacci retracement from $72.62 to $81.86).
Today, consider going long on crude oil around $81.75, with a stop loss at $81.50, and targets at $82.95 and $83.20.

Spot Gold
On Thursday, gold prices rebounded from the significant psychological level of $2,300, trading above $2,325. Following the release of the latest US data, the benchmark 10-year US Treasury yield remained in negative territory, allowing gold prices to extend their rebound. During the Asian session on Thursday, gold prices briefly fluctuated just below the $2,300 mark, solidifying the recent downtrend, hitting a near two-week low reached the previous day. The dollar also rose to its highest level since early May, further weighing on the zero-yield asset gold prices. Additionally, the overall bullish trend in global equities suggests that the path of least resistance for safe-haven gold prices is downward. That said, with signs that US inflation is declining, the market is still pricing in two potential rate cuts by the Federal Reserve this year. This, coupled with ongoing geopolitical tensions and political uncertainties, provides some support for gold prices. Bears seem reluctant to make aggressive bets and prefer to await the crucial US PCE price index release on Friday.
From a technical perspective, the recent failure to gain momentum above the 50-day simple moving average (SMA) of $2,338, followed by a subsequent decline, favors the bears. Moreover, the midweek break below the short-term ascending trend line support around $2,314 also validates the recent bearish outlook. Given that the daily chart's oscillators are gaining bearish momentum, a break below the June swing low support in the $2,287-$2,286 region, followed by some follow-through selling, could drag gold prices towards the 100-day SMA support near $2,252.50. On the other hand, if gold attempts to rebound, it must consistently stay above the crucial $2,314-$2,315 level. Sustained strength could still face resistance around the 50-day SMA, currently around $2,338-$2,340. Further gains might pull gold prices back into the supply zone of $2,360-$2,365.
Today, consider going long on gold around $2,324.00, with a stop loss at $2,320.00, and targets at $2,340.00 and $2,345.00.

AUDUSD
Despite a corrective pullback in the US dollar ahead of the key US Personal Consumption Expenditures (PCE) data release, AUD/USD fluctuated and ultimately settled near the 0.6650 region. During Thursday's Asian session, AUD/USD held steady, trading around 0.6650 after the previous day's rise. The pair found support as speculation grew that the Reserve Bank of Australia (RBA) might hike rates again in August due to heightened inflation concerns. On Thursday, Australia's June consumer inflation expectations rose to 4.4% from 4.1% in May, indicating persistent cost pressures. Inflation remains above the RBA’s target range of 2%-3%, driven by high service costs. Data from the Australian Bureau of Statistics (ABS) showed that the Consumer Price Index (CPI) increased from 3.6% in April to 4.0% in May. RBA Assistant Governor Christopher Kent emphasized the need to remain vigilant against potential inflation growth. Current policies are slowing demand growth and reducing inflation. According to Bloomberg, Kent also mentioned that future rate adjustments cannot be ruled out.
From a technical perspective, the outlook for AUD/USD remains fairly neutral without a clear direction. The 14-day Relative Strength Index (RSI) stays above 50 (currently at 52.30) but remains flat. The Moving Average Convergence Divergence (MACD) continues to show negative values with a series of red bars. Buyers aim to keep AUD/USD above the 20-day Simple Moving Average (SMA) at 0.6642, which is a key defensive line that might determine the pair's future momentum. Holding above the 20-day SMA could target the next levels at 0.6685 (Wednesday's high), 0.6700 (psychological barrier), and then 0.6714 (May 16 high), pointing towards the January 4 high of 0.6760. On the bearish side, the pair could first drop to 0.6600 (psychological level) and 0.6581 (38.2% Fibonacci retracement from 0.6362 to 0.6714). Further declines could bring AUD/USD back to 0.6541 (220-day SMA) and 0.6500 (round number).
Today, consider going long on AUD/USD around 0.6630, with a stop loss at 0.6615, and targets at 0.6680 and 0.6690.

GBPUSD
GBP/USD has rebounded from its lowest level since mid-May, although it lacks any follow-through buying. Before the release of key US macroeconomic data, the fundamental backdrop necessitates caution from bulls. The technical structure indicates that the path of least resistance for the pair is downward. Midweek, GBP/USD fell to the recent low of its trading range at 1.2615 (since May 14), as lukewarm market liquidity supported the US dollar. The pound remains near its lows, struggling to stay above 1.2600. The US May New Home Sales month-over-month came in at -11.3%, down from the previous 2.0% and significantly revised from the initial -4.7%. On Friday, the UK's revised GDP (expected to stabilize at 0.6%) and the US May Personal Consumption Expenditures (PCE) inflation data will conclude the week's trading. The CME FedWatch Tool shows that the market's confidence in a rate cut by the Federal Open Market Committee on September 18 has gradually waned. After peaking at slightly over 70% odds of a September rate cut last week, the probability of at least a 25 basis point cut on September 18 is now close to 60%.
From the daily chart, GBP/USD has failed to rebound above 1.2700 so far this week (peaking at 1.2697) and has broken below Tuesday's low of 1.2670, reaching a new weekly low of 1.2612 after forming a "Evening Star" pattern. As indicated by the 14-day Relative Strength Index (RSI), the momentum supports the bears, with the index remaining bearish and targeting lower levels. Therefore, the path of least resistance for GBP/USD is downward. The next support level is at the 200-day moving average (MA) of 1.2557. Once this area is breached, the psychological level of 1.2500 will follow closely. To sustain a bullish outlook, traders must reclaim the psychological level around 1.2700 and clear the previous support trend line, now turned resistance, around 1.2730/40. Beyond that, trading will continue above 1.2760 (last Monday's high) and 1.2800 (psychological barrier).
Today, consider going long on GBP/USD around 1.2620, with a stop loss at 1.2605, and targets at 1.2670 and 1.2680.

USDJPY
During the Asian session on Thursday, USD/JPY fluctuated lower, giving up some of the strong gains from the previous day, reaching its highest level since 1986. USD/JPY extended its correction from the multi-decade high touched earlier in the day, trading below 160.50. Verbal intervention by Japanese officials seems to be helping the yen alleviate some of the selling pressure, while mixed US data hurt the dollar. Despite the wide interest rate differential between the US and Japan, USD/JPY seems unlikely to undergo a significant correction. In contrast, recent hawkish comments from Federal Reserve officials suggest that the Fed is not in a hurry to start a rate-cut cycle while the economy remains resilient. This, along with the underlying bullish tone in global equities, could continue to undermine the yen’s safe-haven appeal and act as a "boosting factor" for the USD/JPY pair. Meanwhile, investors remain cautious about the possibility of Japanese authorities intervening in the market to support the local currency. Indeed, Japan's Vice Minister of Finance for International Affairs, Masato Kanda, reiterated that the government is ready to take appropriate action if excessive currency fluctuations negatively impact the national economy, providing some support for the yen.
From a recent performance perspective, USD/JPY hit a new 34-year high of 160.87 midweek. If USD/JPY undergoes a technical pullback, it could attract some buying interest around the psychological level of 160.00. Next is the 159.75 level, which was a resistance breakpoint now turned support. If USD/JPY breaks below this level, it may further extend its corrective decline towards the 159.00 round figure. On the other hand, the 14-day Relative Strength Index (RSI) above the 70.00 level indicates strong upward momentum. Momentum indicators favor buyers, with the decade-high around 160.85-160.90 likely to act as immediate resistance. A breakout past the 161.00 round figure with follow-through buying would be seen by bullish traders as a new trigger, paving the way for the continuation of the established uptrend. The next target would be 162.17 (123.6% Fibonacci retracement from 160.20 to 151.85).
Today, consider going short on USD/JPY around 161.00, with a stop loss at 161.35, and targets at 160.00 and 159.80.

EURUSD
EUR/USD has shaken off some of its recent bearish sentiment, returning to the region above the 1.0700 mark. However, despite the broad-based pullback in the US dollar, this bullish attempt seems unconvincing. Midweek, EUR/USD fell to the 1.0680 area following the unexpected decline in Germany’s July GfK consumer confidence survey. With no significant data during the US trading session, investors were concerned about the cautious stance of the Federal Reserve this week and the decreased bets on a September rate cut by the Fed. Germany's July consumer confidence index dropped to -21.8 from the revised -21.0 in the previous month, below the expected value of -18.9. Although the German GfK consumer confidence survey has been slowly and steadily recovering, the weak reading announced on Wednesday added more pressure to the already struggling euro. Market confidence in a September 18 rate cut by the Federal Open Market Committee has declined. The CME FedWatch Tool shows that the probability of at least a 25 basis point rate cut by the Fed in September has dropped from just over 70% last week to around 60%.
From a technical perspective, the week's price action continues to be squeezed between the 50-day moving average at 1.0734 and the upper boundary of the daily descending channel at 1.0705. If the bulls fail to break out of this pattern of lower highs, EUR/USD will likely drop back to the recent low below 1.0666 (Wednesday's low). EUR/USD is in an overall descending channel, with the daily chart inclined to the downside. If EUR/USD finally falls to 1.0601 (April 16 low) and 1.0600 (psychological level), it could see a bullish rebound above 1.0700, further rising to the 50-day moving average at 1.0734 and the 1.0800 psychological barrier. If the decline continues, EUR/USD will refresh the lows of 2024.
Today, consider going long on EUR/USD around 1.0685, with a stop loss at 1.0670, and targets at 1.0740 and 1.0750.

Disclaimer: The information contained herein (1) is proprietary to BCR and/or its content providers; (2) may not be copied or distributed; (3) is not warranted to be accurate, complete or timely; and, (4) does not constitute advice or a recommendation by BCR or its content providers in respect of the investment in financial instruments. Neither BCR or its content providers are responsible for any damages or losses arising from any use of this information. Past performance is no guarantee of future results.


